There is no regular national recording of information regarding the out-of-hours services in Norway; e.g. the number of requests, who makes the requests, the degree of emergency or what action has been taken. In some places local records are available on the number of requests to casualty clinics or local Medical Emergency Communication Centres (LEMC), the number of consultations and other types of information, but different definitions have been used and recording is not done in the same way, so comparisons are not possible. The Norwegian Labour and Welfare Organisation (NAV) have information of interest in this context (e.g. reimbursement card for GPs), but this is not available for the public.
One of the responsibilities of the National Centre for Emergency Primary Health Care (1) is to contribute to public statistics, survey development trends and provide a basis for research projects. The Centre has therefore planned The Watchtower Project, which is to record relevant data from a representative selection of municipalities or out-of -hours districts. As an introduction to the project, a pilot study was undertaken at three different types of casualty clinics in the spring of 2006. The main aim of this study was to test the groups of variables, the method of recording and the practical conditions and to give a first indication of the extent and distribution of requests, consultations, priority grades and action taken at casualty clinics in Norway. Data from the pilot study form the basis of this article, which concerns requests to out-of-hours services and the action taken in response.
Material and methods
Three casualty clinics took part in the pilot study in response to an open invitation given to clinics and at conferences. Tromsø’s out-of-hours service represents a larger town (63 596 inhabitants), Nordhordland’s service is an intermunicipal cooperative that covers seven municipalities (29 021 inhabitants) and Nes is a medium-sized central rural district (18 022 inhabitants) (2). All three had an organized out-of-hours service with a 24-hour clinic with nurses. The Tromsø - and Nordhordland services had nurses and a doctor in their clinic at all hours, whereas Nes had a doctor on duty in another location than the nurse during the day on weekdays.
The three casualty clinics recorded all requests at all hours for four weeks from 6.3. 2006 to 2.4. 2006. The following variables were recorded for each request/patient: home municipality (number and name of municipality), year, week number, day of the week, time of day or night, sex, age, mode of contact, degree of urgency and action taken. Diagnoses, symptoms or problems were not recorded for the requests. The time of day was defined as day (8 am - 3 29 pm), evening (3 30 pm - 10 59 pm) and night (11 pm - 7 59 am). The degree of urgency (priority grade) was measured according to the Norwegian Index for Medical emergency Assistance (Triage box 1) (3). Data were collected at the individual level and each request counted as a unique entry in the matrix. Data from each week, Monday 00:00 hrs up to and including Sunday 24:00 hrs of the same week, were sent to the National Centre for Emergency Primary Health Care by the end of the following Wednesday.
Box 1
Definition of priority grades in accordance with the Norwegian Index for Medical emergency Assistance (and triage) (3)
Green priority: Normal
Yellow priority: Urgent
Red priority: Acute
The nurses on duty did the recording. All variables and possible interpretations were explained and clarified with all the nurses and their leaders at meetings with the project leader before the start of the project. The form to be used for recording was also tested out by the clinics beforehand. The nurses were responsible for recording requests to the out-of-hours service consecutively, whereas quality assurance and submitting of data was delegated to a defined project coordinator at each clinic. The project coordinator was to ensure that data from all requests were correctly recorded each week.
The Centre had prepared a recording form in an Excel accounting sheet, which was used by the Nes - and Nordhordland clinics. Tromsø used their own electronic programme (tested and accepted by the Centre beforehand), which was specially suited to the pilot study’s aims.
The statistical programme SPSS version 13.0 was used to analyze the results. Chi-square tests were used and the statistical significance was defined as p < 0.05.
Results
Requests
The three clinics covered a population of altogether 110 639 inhabitants and received a total of 5 041 requests during the study period. The rate for all requests collected during the four weeks was 46/1 000 inhabitants (29 in Tromsø, 47 in Nes and 84 in Nordhordland). The total proportion of women was 55 %, with small variations between the clinics. There were significant differences in age among the patients requesting help from the three clinics (p < 0.0001). In total, the age group 0 - 14 years comprised a third of the requests. Patients above 60 years of age represented the lowest proportion of requests at all three clinics (Table 1).
|
Table 1 Requests to three casualty clinics (covering a total population of 110 639 inhabitants) were recorded over four weeks. The 5 041 requests were grouped by age per 1 000 inhabitants
|
|
Age (years)
|
Nes
|
Tromsø
|
Nordhordland
|
|
0 - 14
|
18
|
8
|
28
|
|
15 - 34
|
9
|
10
|
23
|
|
35 - 59
|
12
|
7
|
18
|
|
60+
|
7
|
4
|
13
|
Of all requests, 64 % were recorded on weekdays and 36 % at weekends. Requests to the three clinics were fairly evenly distributed during weekdays (results not shown), but the timing of requests varied a lot. Whereas requests (per 1 000 inhabitants) made to the clinics during normal work hours was seven times higher in Nordhordland than in Tromsø, the rate at night was fairly similar. Figure 1 shows the request rate per 1 000 inhabitants at different times of the day or night all days of the week. Only 25 % of the patients in Tromsø rang before presenting at the clinic, while those in Nes (83 %) and Nordhordland (91 %) usually called before coming. Requests from the Emergency Medical Communication Centres (EMC) comprised less than 2 % in all the casualty clinics.
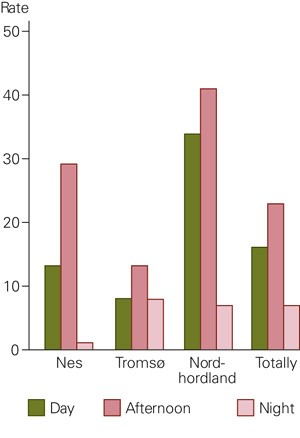
Figure 1 Requests to the emergency services by day, evening or night, recorded over four weeks (5 041 contacts) in three emergency service districts (rates per 1 000 inhabitants in a total population of 110 639)
Degree of urgency
There were significant differences in the distribution of the recorded priority grades among the clinics (p < 0.0001) (Figure 2). Nes and Nordhordland had a large majority of the priority grade green, whereas Tromsø had equal proportions of yellow and green. The priority grade red comprised 7 % of the grades in Tromsø (more than double the number in Nes and Nordhordland). The priority grade red was given most frequently at night, and patients above 60 years accounted for the largest number of reds in all three clinics.
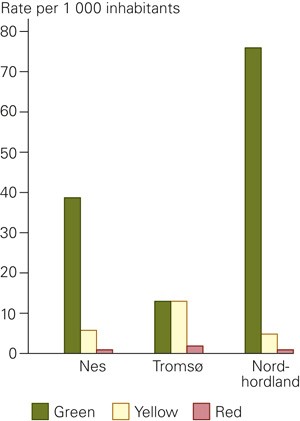
Figure 2 Priority grades recorded over four weeks (5 041 contacts) in three out-of-hours districts; rates per 1 000 inhabitants in a total population of 110 639
Action taken
Table 2 shows the action taken in response to the requests. There were large differences in the rates of consultations that were concluded both with a doctor and advice from nurses. Nes and Nordhordland had comparable proportions of consultations with yellow grades (71 % and 76 %), while Tromsø had 83 %. Tromsø also had the highest percentage of consultations with green and red grades and the highest percentage of consultations in all age groups of patients.
|
Table 2 Action taken for all requests to three emergency clinics during four weeks; total numbers, distributions between the actions and rates per 1000 inhabitants
|
|
Nes
|
|
Tromsø
|
|
Nordhordland
|
|
All
|
|
N
|
%
|
Rate per 1 000
|
N
|
%
|
Rate per 1 000
|
N
|
%
|
Rate per 1 000
|
N
|
%
|
Rate per 1 000
|
|
Nurse advice
|
220
|
26
|
12
|
|
334
|
18
|
5
|
|
1 070
|
44
|
37
|
|
1 624
|
32
|
15
|
|
Telephone consultation with doctor
|
120
|
14
|
7
|
|
89
|
5
|
1
|
|
102
|
4
|
4
|
|
311
|
6
|
3
|
|
Consultation with doctor
|
454
|
54
|
25
|
|
1 304
|
73
|
21
|
|
1 151
|
48
|
40
|
|
2 909
|
58
|
26
|
|
Doctor sent with ambulance
|
7
|
1
|
0.3
|
|
29
|
2
|
0.5
|
|
24
|
1
|
0.8
|
|
60
|
1
|
0.5
|
|
Home visit with doctor
|
13
|
2
|
0.7
|
|
14
|
1
|
0.2
|
|
4
|
0
|
0.1
|
|
31
|
1
|
0.3
|
|
Other1
|
23
|
3
|
1
|
|
17
|
1
|
0.3
|
|
62
|
3
|
2
|
|
102
|
2
|
1
|
|
Missing
|
3
|
|
|
|
0
|
|
|
|
1
|
|
|
|
4
|
|
|
|
Total
|
840
|
100
|
|
|
1 787
|
100
|
|
|
2 414
|
100
|
|
|
5 041
|
100
|
|
|
[i]
|
The proportion of doctor and ambulance and home visit by a doctor was highest for patients above 60 at all three casualty clinics, and there were no home visits in the 0 - 14 age group recorded.
Discussion
The pilot study adhered to the protocol without many practical problems. The routine for keeping records worked well and the experience provided the basis for developing the Watchtower Project at a nationally representative level. The choice of casualty clinics for the pilot study was strategic, but even though a large number of inhabitants gave stable results already during four weeks, we do not know how representative our casualty clinics are in relation to the rest of the country. We therefore choose to put less emphasis on the absolute levels of requests and measures taken and instead concentrate on the large differences found between the three casualty clinics. Even so, this is probably the largest and most systematic study of out-of-hours service requests in Norway. The results indicate that out-of-hours service activities in Norway differ greatly between municipalities. The population’s use of and the municipality’s planning needs for such services vary independently of the medical needs, strictly understood, which are presumably very much alike in a country such as Norway. The large variation in the contact rate during work hours may be due to more difficult access to GPs in some districts.
A study of out-of-hours services and the RGP Scheme (4) in Skien in 2004, showed that poor accessibility was mainly due to poor telephone services and a varying capacity to receive patients needing emergency care, as well as the degree of service-mindedness from the staff at the doctors’ surgeries. The RGPs’ accessibility has not been considered in this study, but may be a possible cause of the high off-hours contact rate in Nordhordland. The study of the RGP scheme and the out-of-hours service in Bergen from 2004 (5) showed that three quarters of those contacting the casualty clinic in Bergen had not tried to contact their RGP first and of those that had done so, only 8 % received an appointment for the same day.
A possible explanation for why most patients in Nordhordland called the casualty clinic first is that the clinic there gives clear public information. The management and staff have «trained» people in the district to contact the casualty clinic by phone and they have adhered to this routine consistently. The casualty clinic in Nes has not had a doctor present during office hours, but rather a doctor on call at the GPs’ surgery. This may explain why the local people also in Nes contacted the casualty clinic by phone. The proportion of patients at the three casualty clinics who were advised by nurses varied greatly. There may be several reasons why Tromsø had the lowest proportion. But 72 % of the patients who contacted the Tromsø clinic went there directly without phoning first and it is often easier to offer consultations with a doctor when patients are on the spot. The Tromsø clinic also had a much higher rate of yellow and red priority grades than the other two clinics. In accordance with the Medical Index, nurses are not to advise patients as the final measure in emergency cases with a yellow or red grade.
The low proportion of home visits and doctors sent out with ambulances in this study cannot entirely be explained by intermunicipal cooperatives, as the proportion was low also at the municipal level.
There is a great need of epidemiological data on emergency services in Norway, but there is no national system for checking relevant activity data. Developing a system for collecting data from a large representative selection is probably the only project that can be carried out with sufficient quality and validity as of today. The National Centre for Emergency Primary Health Care has seen it as their task to set up just such a monitoring system. Based on our experience from the pilot study, we will be carrying out a full scale project from 2007.
