These days a doctor is almost always a specialist, and the specialty status is a crucial component of any individual doctor”s identity. Nevertheless, many doctors find that their choice of specialty is somewhat arbitrary. In 1997, the median time from receiving qualification as a medical doctor to obtaining a specialty was eight years in Norway, and many doctors changed their specialty during the specialisation period (1). Thus, the rationale or motivation behind the final choice of specialty appears to be rather complex.
There is no clear association between the number of specialists in the various medical fields, and the need for them. Examples of topical «under-stocked» fields are psychiatry and geriatrics. For other fields, it could be considered that there are too many specialists, even though this is more difficult to demonstrate.
Both diseases and medical specialties have their own hierarchical structures (2, 3). It appears to be easier to recruit specialists to fields that have a high status rather than to those lowest on the ladder, such as psychiatry and geriatrics. In a previous study of how the specialty preferences of Norwegian medical students altered, from the beginning of their studies in 1993, up to halfway through their studies, the main tendency was a movement upwards in the specialty hierarchy (4, 5).
Material and methods
This research was conducted as a prospective, unbalanced, and anonymous cohort study with two groups of participants, and distribution of questionnaires on four occasions between 1993 and 2003. An unbalanced cohort study is a prospective study, which allows subjects to join or drop out of the study during the study period.
The first group «the student group» comprised 421 students (189 men and 232 women) who started their basic medical studies at Norwegian universities and received the first questionnaire in 1993. Questionnaires were also distributed in 1996 and 1999; a number of new students were included, whilst a few dropped out of the study. The last questionnaire round was in 2003, and by then most of the students who were first included had begun their specialisation.
In the second group, «the doctor group», all those who had completed their medical exams at Norwegian universities in 1993 and 1994 (n = 631) received the first questionnaire in their final year of study, with the follow-up questionnaires being sent to them during their house physician period (1994/95), and during specialisation (1997/98). The final questionnaire round in this group was in 2003/04, by which time the majority of doctors had chosen or completed their specialty. Figure 1 is a flow diagram of the two groups.
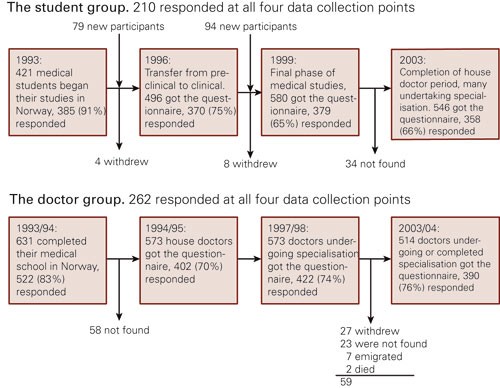
Figure 1 Schematic representation of «the student group» and «the doctor group»
Grouping of specialties
In 1993, 1996 and 1999 the students were asked to choose the three professional fields of most interest to them from a list of 53. The 53 fields were categorised into five groups for simplification of the analyses: general medicine and social medicine; laboratory-based fields; internal medicine; surgery and psychiatry (e-tab 1).
|
Table 1 Medical fields categorised into five main groups. Numbers after dashes give prestige scores for each field, from 1 (lowest) to 22 (highest). Prestige scores were obtained from Album”s original article (2) for fields marked with an asterisk (*), while the authors of this article scored the others. Medical fields marked with a double asterisk (**) are not actually recognised as medical specialties, but were nevertheless included in the questionnaire
|
|
General medicine
|
General medicine* - 4
|
|
Social medicine - 4
|
|
Occupational medicine - 4
|
|
Laboratory medicine
|
Anatomy** - 8
|
|
Biochemistry** - 8
|
|
Clinical biochemistry - 8
|
|
Clinical neurophysiology - 8
|
|
Clinical pharmacology - 8
|
|
Clinical physiology** - 8
|
|
Immunology and transfusion medicine - 14
|
|
Medical genetics - 8
|
|
Medical microbiology - 8
|
|
Neuropathology** - 8
|
|
Pathology - 8
|
|
Physiology** - 8
|
|
Radiology - 8
|
|
Internal medicine
|
Blood diseases - 14
|
|
Dermatology and venereal diseases* - 2
|
|
Digestive diseases - 14
|
|
Endocrinology - 14
|
|
Epidemic diseases ** - 14
|
|
General internal medicine* - 14
|
|
Geriatrics* - 1
|
|
Cardiovascular diseases* - 21
|
|
Infectious diseases - 14
|
|
Kidney diseases - 14
|
|
Lung diseases* - 7
|
|
Neurology* - 8
|
|
Oncology* - 15
|
|
Opthalmology* - 10
|
|
Paediatrics* - 17
|
|
Physical medicine and rehabilitation* - 5
|
|
Rheumatology* - 6
|
|
Sports medicine** - 4
|
|
Tropical diseases** - 14
|
|
Surgery
|
Anaesthesiology* - 19
|
|
Gastric surgery* - 13
|
|
General surgery* - 18
|
|
Gynaecology and obstetrics* - 12
|
|
Neurosurgery - 22
|
|
Oral and maxillofacial surgery - 18
|
|
Orthopaedic surgery* - 17
|
|
Otolaryngology* - 9
|
|
Paediatric surgery - 18
|
|
Plastic surgery - 18
|
|
Rheumatic surgery*,** - 11
|
|
Thoracic surgery* - 20
|
|
Urology - 18
|
|
Vascular surgery - 18
|
|
Psychiatry
|
Adult psychiatry* - 3
|
|
Child and adolescent psychiatry - 3
|
The table also gives the prestige score for each of the specialties, as based on Album”s previous studies (2, 6). Album, however, scored only 22 specialist fields and sub-specialties, (marked by an asterisk in the Table). The other fields have been ranked to one of these 22 levels, depending on our assessment. For the student group, we have calculated three «prestige indexes»; based on the most popular medical specialties at the beginning of their studies, halfway through their studies, and at the end of their studies.
Rationale behind choice of specialty
At each data collection point, the participants were asked to assess the importance of 26 conditions when they answered the question: «How important do you believe the following factors will be for you when you, as a doctor, will choose your working environment and your specialty?» The doctors who had completed their training received the same list, but with the following opening question: «How important are/were the following factors for you when you chose your work environment and/or your specialty?» These questions are repeated in table 2. The response options were given numerical values from 1 (not important) to 4 (very important) and five for «don”t know». The answers were dichotomised to «important» (important and very important) and «not important» (not important, slightly important, don”t know) and combined into three motive types - «active», «defensive» and «integrated» (tab 2). The classification of types was based on a combination of explorative factor analyses and our own discretion.
|
Table 2 Assessment of the statements «How important do you believe the following factors will be for you when you, as a doctor, will choose your working environment and specialty?» (1993, 1996 and 1999), or for students «How important are/were the following factors for you when you chose your field of work and/or your specialty?» (2003). The table shows percentages with a positive answer on the three different occasions and the ranking of the statements after horizontal addition. The mean value is given on a scale from 0 to 1 for the three main motive types
|
|
Active
|
1993
|
1996
|
1999
|
2003
|
Ranking
|
|
2 Challenges in life-or-death situations
|
22
|
19
|
25
|
24
|
20
|
|
3 Good medical career possibilities
|
41
|
42
|
48
|
|
14
|
|
5 Good administrative career possibilities
|
12
|
10
|
10
|
6
|
24
|
|
10 High degree of independence
|
64
|
67
|
68
|
67
|
6
|
|
14 Possibility for research
|
41
|
26
|
28
|
26
|
16
|
|
19 Considerable technical work/ hands-on work
|
24
|
21
|
27
|
27
|
18
|
|
21 Challenges in responsibilities and decision making
|
38
|
24
|
33
|
38
|
13
|
|
22 Good salary conditions
|
66
|
69
|
77
|
66
|
5
|
|
25 See results from work rapidly
|
28
|
33
|
39
|
38
|
12
|
|
Mean score «active»
|
0.37
|
0.35
|
0.39
|
0.36
|
|
|
Defensive
|
|
|
|
|
|
|
4 Avoid having to give bad news to patients
|
3
|
3
|
2
|
2
|
26
|
|
6 Possibility for part-time positions
|
23
|
35
|
40
|
24
|
15
|
|
7 Avoid negative media reports
|
8
|
19
|
10
|
3
|
23
|
|
9 Avoid seriously ill children
|
2
|
4
|
7
|
10
|
25
|
|
11 Small amount of «on call» duties
|
23
|
46
|
44
|
46
|
11
|
|
13 Can make mistakes without resulting in enormous consequences
|
20
|
24
|
22
|
15
|
21
|
|
15 Avoid work environments obsessed with career advancement
|
30
|
27
|
29
|
24
|
17
|
|
24 Complaints about incorrect treatment are rare
|
16
|
21
|
25
|
13
|
22
|
|
Mean score «defensive»
|
0.16
|
0.22
|
0.22
|
0.18
|
|
|
Holistic
|
|
|
|
|
|
|
1 Interested in this professional field
|
97
|
99
|
98
|
91
|
7
|
|
8 Possibilities for child care places
|
41
|
43
|
55
|
22
|
10
|
|
12 Possibilities for permanent job
|
91
|
88
|
89
|
66
|
3
|
|
16 Diversity and variety
|
88
|
89
|
93
|
86
|
2
|
|
17 Living in a selected place
|
48
|
52
|
57
|
62
|
8
|
|
18 Socially important field
|
54
|
38
|
38
|
38
|
9
|
|
20 Considerable contact with patients
|
86
|
81
|
76
|
69
|
4
|
|
23 Time for family
|
94
|
93
|
97
|
83
|
1
|
|
26 Social and psychological factors
|
34
|
21
|
23
|
16
|
19
|
|
Mean score «comprehensive»
|
0.70
|
0.67
|
0.69
|
0.58
|
|
Motive goals were studied further, the effect of age, sex, and specialty on changes in motivation factors over time, in the student group with a multivariate, multi-level model with repeated measurements. SPSS version 14 was used for the analyses.
Results
Figure 1 shows responses by time-points for both groups. The proportion of women among those who participated at least once was 57 %, and in 1993/94 the mean age for both groups together was 28.1 years.
Choice of specialty
The student group. In 2003, 78 % (282/358) of participants had chosen their medical specialty. Figure 2 shows a comparison of the distribution between sexes and main specialty group in 2003 (this study) and that of all active Norwegian medical specialists the same year. The distribution of specialty preferences with respect to start and completion of medical studies is also shown.
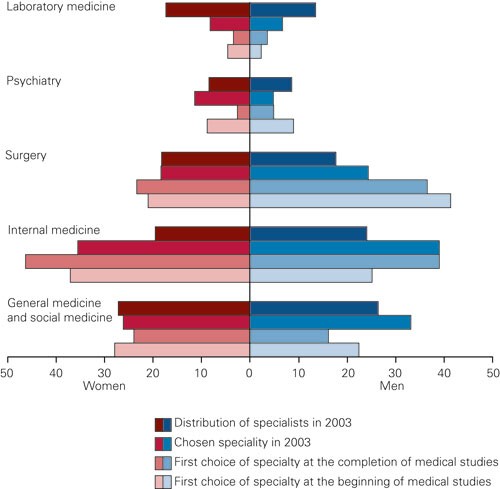
Figure 2 Distribution of preferred specialties at the beginning of medical studies (1993), at the end of studies (1999), after choice of specialty (2003) and among medical specialists in Norway in 2003. Percentage. Data from the student cohort
Which specialty any individual preferred varied greatly during the course of their studies. We wanted to investigate whether an individual”s preference moved from one specialty group to another. By assigning one point for each time a medical student”s preference moves from one main specialty group to another, we obtain a variable which ranges from 0 (those who remained in the same group throughout the study) to 3 (those who had moved to a new group on each data collection). The mean value for the 167 individuals who had chosen their specialty by the end of the study, and who had indicated a specialty”s preference on each of the four occasions of data collection, was 1.49. The most stable field of specialty - surgery - had a mean value of 1.15 (95 % CI 0.66 - 1.64). For gynaecology the mean value was 1.17, for internal medicine 1.23, for anaesthesia 1.50, for psychiatry 1.70, for general medicine 1.86, and for those who chose a laboratory-based field the mean number of changes was 2.08 (95 % CI 1.56 - 2.60).
Figure 3 also illustrates this lack of stability in the student group”s specialty preferences. The proportion that chose a particular specialty remained rather stable, but the groups consist of different individuals at the various time-points.
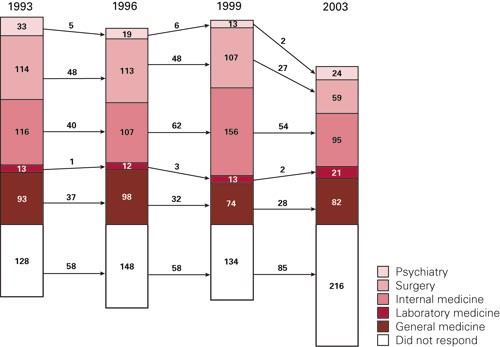
Figure 3 The student group. The most popular fields of specialty at the start of medical studies (1993), halfway through studies (1996), at the end of studies (1999) and at the time the specialty was chosen (2003). Percentage columns with numbers of respondents and non-respondents. The arrows with numbers show how many students remained in the same group from one data collection time-point to the next
The doctor group. Figure 4 shows that there was also a comparatively comprehensive change in preference for particular specialties among doctors who had completed their studies. The distribution of doctors between the groups of specialties in 1997/98 and 2003/04 is quite similar, but almost 50 % of the individual doctors changed their specialty preference in this period.

Figure 4 The doctor group. The most popular specialties at the end of medical studies (1993/94), as interns (1994/95), four years after qualification (1997/98), and 10 years after qualification (2003/04). Percentage columns with the number of respondents, and non-respondents. The arrows with numbers show how many remained in the same group from one data collection time-point to the next
Specialty prestige. Album”s prestige ranking was used as a possible explanation for the development and change in specialty choices. Among female medical students in particular, there was a trend towards choosing increasingly prestigious specialist fields during their studies, but a significant «prestige loss» occurred when the specialty was actually chosen in 2003 (fig 5).
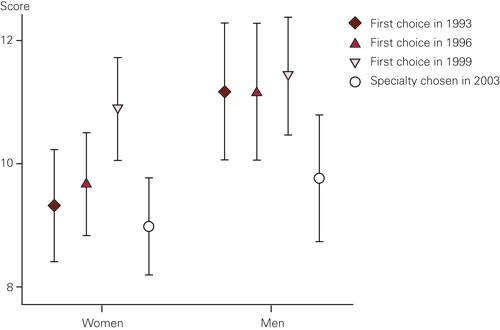
Figure 5 The student group. Prestige scores for the most popular medical specialty groups at the beginning of the medical studies (1993), halfway through studies (1996), at the end of studies (1999), and at the choice of specialty field (2003). Mean values with 95 % confidence intervals on a scale of 1 (lowest) to 22 (highest)
Rationale for choice of medical specialty
Table 2 shows the proportions that gave positive answers to each of the 26 statements on possible reasons for choosing a particular specialty; in 1993, 1996, 1999, and 2003. Additionally, all the statements are ranked, based upon the mean score value obtained at each of the four data collection times. «Time for family» was the motive that received the most votes and «to avoid having to give bad news to the patients» received the least votes.
In order to investigate possible changes in rationale behind the choice of specialty, and differences in the motives associated with the choice of the various specialties over time, we used the combined mean values for the three motive types in a multi-level analysis of repeated measurements in the student cohort (tab 3 and tab 4). The motive types «active», «defensive» and «integrated» were used as dependent variables in three separate analyses, with sex, age, and choice of specialty in 2003 as independent variables (factors). The analyses demonstrated that there was a significant difference between the groups of specialty and non-specialists, and between men and women, and that the impact of the three motive types decreased over time.
|
Table 3 Change in motive types over time, from T1 to T4, and differences in motive scores between specialty groups and non-specialists in the student group. A multi-level model was used; three separate analyses were made with repeated measurements of the three motive areas as dependent variables and with age, sex, and chosen specialty (group) in 2003 as independent variables. The reference for the specialty group is «non-specialist». Non-standardised beta values indicate the size (numerical value) and direction (positive or negative) of the actual effect and associated p-values. Significant values are italicised (p < 0.05)
|
|
Active
|
Defensive
|
Holistic
|
|
Change T1 to T4 for all
|
-0.06 p = 0.038
|
-0.08 p = 0.005
|
-0.40 p < 0.001
|
|
Age (changes per year)
|
0.00 p = 0.531
|
0.01 p = 0.395
|
-0.01 p = 0.019
|
|
Women (compared with men)
|
-0.27 p < 0.001
|
0.17 p < 0.001
|
0.12 p < 0.001
|
|
Surgery
|
0.14 p = 0.020
|
-0.12 p = 0.027
|
-0.04 p = 0.359
|
|
Internal medicine
|
0.06 p = 0.353
|
0.00 p = 0.993
|
0.04 p = 0.369
|
|
General medicine
|
0.05 p = 0.371
|
0.08 p = 0.095
|
0.07 p = 0.107
|
|
Psychiatry
|
-0.14 p = 0.149
|
0.13 p = 0.111
|
0.21 p = 0.004
|
|
Laboratory medicine
|
-0.08 p = 0.415
|
0.04 p = 0.654
|
-0.13 p = 0.077
|
|
Table 4 Alteration in score for the three motive areas over time, from T1 to T4, for the specialty groups, controlled for age and sex, in the student group. The reference is «non- specialist». A multi-level model was used; three separate analyses were made with repeated measurements of the three motive areas as dependent variables and with interaction between time (T1-T4) and specialty group as explanatory variables. Non-standardised beta-values indicate the size (numerical value) and direction (positive or negative) of the change in score of the motive area and associated p-values. Significant effects are italicised (p < 0.05).
|
|
Active
|
Defensive
|
Holistic
|
|
Surgery
|
0.32 p = 0.001
|
-0.22 p = 0.006
|
-0.12 p = 0.216
|
|
Internal medicine
|
0.06 p = 0.202
|
-0.29 p = 0.001
|
0.01 p = 0.879
|
|
General medicine
|
0.08 p = 0.380
|
-0.07 p = 0.414
|
0.14 p = 0.110
|
|
Psychiatry
|
0.11 p = 0.421
|
0.15 p = 0.257
|
0.37 p = 0.008
|
|
Laboratory medicine
|
0.04 p = 0.794
|
0.12 p = 0.369
|
-0.08 p = 0.543
|
Women scored significantly lower than men on the «active» motives and higher on the «defensive» and «comprehensive» motive types. In the comparison with non-specialists, surgery had a high score for «active» and a low score for «defensive». The scores for «active» motive types increased over time, but were reduced over time for «defensive». The score for internal medicine was also low for «defensive», and the score decreased over time. Psychiatry scored highly for «integrated», and this score increased gradually over time. General medicine scored somewhat higher than the non-specialists for «defensive», but the difference was not significant.
Discussion
In comprehensive prospective studies, there is always a problem with drop-outs during the course of the study, as was the case for this one. Nevertheless, we believe that the representation within our groups was satisfactory. Complete participation (i.e. responding on all four occasions) of 50 % in the student group and 42 % in the doctor group should be considered sufficiently satisfactory. The actual N value in the multi-level analyses is higher as all those who answered on at least two occasions are included in the correlation matrices (for the student cohort N ranged between 260 and 286). The data are strengthened by the fact that 91 % of participants in the student group and 89 % in the doctor group responded at least on one occasion. A further strength of this study is that it includes complete cohorts of Norwegian students and doctors, rather than random or stratified samples from each group.
The most conspicuous finding was the magnitude of change in individual preferences and choices regarding specialty, which continues long after completion of medical studies. However, at the same time the proportion of doctors who chose surgery, internal medicine, general medicine, or psychiatry as their career paths changed negligibly. This can perhaps be explained by actual demand. However, it appears that the pattern is established almost from the start of medical studies, and long before the students have begun to consider the options for their working lives.
Multi-level analyses of motivation scores show that there are also differences between the medical fields. It appears that men who were particularly concerned about their careers, independence in the work environment, the possibility for undertaking research, and other aspects of the «active» motive type, increasingly turned towards the professional specialties of surgery. Women who were concerned with organising work conditions so they could have a stable family life, and were interested in work with variety and diversity, as well as other aspects of the «integrated» motive type, turned towards psychiatry.
Psychiatry and laboratory-based medicine appear to be «winners» in that more physicians choose these specialities than what could be expected from those who indicated them as preferred specialties at the end of their medical studies or as house doctors. In addition, psychiatry seems to «win» further specialists in the period 4 - 10 years after qualification (the doctor group) - which is perhaps a positive signal when considering future needs. There might also be an association between this and a relatively large number of newly established positions created to strengthen the field of psychiatry. A Canadian study showed that those who chose psychiatry were doctors who were interested in mental health before they began to study medicine and doctors who made their choice through an elimination process based on positive experiences with psychiatry during the course of their studies and during specialisation, as well as negative experiences from other specialties (7). This tendency might also perhaps be associated with the increasing number of female doctors, who generally score significantly lower on the «active» motivation type.
The fields of surgery lose candidates during the physicians” careers, but this study cannot give a realistic picture of the surgery group due to its heterogeneity. Orthopaedic surgery is one of the specialties with good recruitment (8). From this study, we are unable to analyse the patterns or the prognoses for the individual specialties because the data sets are too small. It is worth noting that within surgery, men tend to move away from this field to a greater extent than women. An American study demonstrated that the choice of a career in surgery was also associated with the extent to which the students were able to participate practically in operations during the course of their studies (9, 10).
It has been shown that medical studies in Norway do not amplify segregation by sex in medical specialty preferences (5). This research indicates that the same applies to the period as intern and the first years as a doctor. Nevertheless, the analyses show that women and men have different preferences and priorities regarding career and choice of specialty. This concurs with results from studies in Finland and Switzerland (11, 12).
Alterations in career preferences generally move towards less prestigious medical specialties than the ones originally considered. Whether the doctors actually become less interested in the more prestigious fields, or the cause for this change is more pragmatic cannot be explained by our data. However, studies from abroad show that this type of retraction from more prestigious fields is associated with the young doctors realising how choice of certain specialties or types of work may result in an extensive strain on their private lives (13 – 15).
Will the new knowledge obtained from this survey have an effect on recruitment to the specialties? The doctors who choose psychiatry have least interest in acute medicine and a good salary and are more interested in obtaining kindergarten places and having a normal family life. It can seem that recruitment to positions of low prestige in remote areas could be improved by taking into account that many young doctors are married to doctors, and that both would like to have both a satisfactory working life and a normal family life. It can also be expected that the increasing number of female doctors will result in a shift towards the more care-related specialties, which has been the case in Finland (11).
