Smoking habits among adults in Norway have changed during the last 30 - 40 years. In 1973, 51 % of men and 32 % of women smoked daily (1); in 2006, 24 % of both men and women smoked daily. While smoking among men decreased steadily during the entire period, the decrease for women (across all ages) did not become visible until after 1998. A cohort effect for women concealed the fact that smoking decreased for them as well. Within the age groups, the decrease was quite parallel for both sexes (2).
The decrease in smoking has not been equally steady in the younger age groups. In the 1990s several studies showed an increase in smoking among adolescents and younger adults (3 - 5). This increase has been explained in different ways; one explanation is that the government did not allocate much money to anti-smoking campaigns in the 1980s and the first part of the 1990s. Another hypothesis was that children and adolescents in this period had mothers belonging to a generation with a large proportion of smokers. It is also possible that tobacco use among youth is associated with variation in buying power and changing fashions and trends. Also, studies in other countries have shown that smoking among adolescents may increase in periods after a decrease (4, 6).
In this article we describe changes in smoking and use of snus among pupils in secondary school. We will use data from a series of studies on tobacco use, conducted among pupils in secondary school in the period 1975 - 2005. We will especially direct attention to changes that have come about after the year 2000. This period is of particular interest since Dagfinn Høybråten (the Minister of Health) in 2002 publicly announced that the goal of the government was to halve smoking among adolescents during a 5-year period (7). Many thought this goal was too optimistic. We will also look into the association between smoking and snus use among two subgroups where use of snus is sufficiently common to make such analyses meaningful, i.e. among boys in 10th grade in 1985 and 2005.
Material and method
1975
The National Council on Smoking and Health (now - the Tobacco Control Department in the Norwegian Directorate of Health) undertook a nationwide survey on smoking habits in 1975 among pupils in the last grade of primary school and all three grades in secondary school. Questionnaires were sent to all the country’s schools with pupils in the grades mentioned. The forms only contained a few questions (sex, grade, parents’ restrictiveness in relation to children’s smoking, the pupils’ smoking habits, and smoking habits of parents, siblings and best friend); the study could therefore be undertaken for all pupils in the relevant grades.
The schools could choose whether they wished to inform parents about the study in advance. The questionnaires were completed in class and the teacher collected data according to a standard procedure that would ensure anonymity. A text about the study, which emphasised that participation in the study was voluntary, was first read aloud before data collection in class. The results were counted in each school and reported in forms which had been designed for this specific purpose.
Questionnaires completed by pupils born on the 6th of each month were put into separate envelopes. The envelopes were closed and sent unopened to the Tobacco Control Department of the Norwegian Directorate of Health. As there is no obvious reason that pupils born the 6th of any month have smoking habits different from other students, one assumed that this sample could be regarded as statistically representative and equivalent to samples obtained by simple random sampling.
Subsequent data collections
Similar studies were carried out each 5th year up to 2005, altogether seven times. From 1980 and onwards, the lowest grade was not included, as the proportion of smokers in this young age group was quite small. For the period 1980 to 2005, the studies therefore only comprised pupils in secondary school. Questions on snus were included from 1985. The results presented in this article are based on data from pupils in secondary school for all the seven studies. The Directorate of Health administered the first five data collections and TNS Gallup administered the two last ones. The questions that form the foundation for this article have not been changed and the procedure for collecting data at the schools has been the same all the time.
In this article we have used two questions on smoking. The first one was: «Do you smoke?» The response categories were: «daily, every day», «sometimes or very seldom» and «never». The second question was «How many cigarettes do you normally smoke during a week (7 days?») For this question the pupils were asked to report number of cigarettes. Before statistical analysis, missing data were replaced with data based on answers to other questionnaire items when this was possible. When inconsistencies across variables were identified, all relevant cells were coded as missing. Frequency of snus use was measured in the same way as frequency of smoking, but the snus use per day or week was not recorded.
A small proportion of pupils (1.7 % of those who said they smoked daily) reported to use an unrealistically high number of cigarettes. These responses were all recoded into 140 cigarettes per week - a high number for adolescents in the age groups in question.
The statistical analyses comprise contingency tables with chi-square testing for description of changes in frequency of tobacco use; arithmetic means with analyses of variance to describe changes in cigarette use among daily smokers, and polychotomous logistic regression analysis to test whether the association between smoking habits and snus use was different in 1985 and 2005. In the cases where the chi-square testing concerns increase or decrease over time for more than two time points, we have used testing of linear trends.
Results
Participation
The number of pupils who participated in each data collection was compared with the number of pupils from relevant school years attending the grades in question (information obtained from Statistics Norway). If all schools and pupils had participated, every data collection could theoretically have provided data for a population of about 3.3 % of all pupils. For all the school years, except for 2000/2001, the proportion of pupils (both among boys and girls) in the sample was 2.6 or 2.7 % of the population. This corresponds to a participation rate of 79 - 82 %. The data collection for the school year 2000/2001 only comprised 2.3 % of the pupils. This corresponds to a participation of around 68 %, which means that results for the school year 2000/2001 are slightly less reliable than those for the other years.
Smoking habits
In the 8th and 9th grades, the proportion of daily smokers and the proportion of experimental smokers (those who reported that they sometimes smoked or smoked very seldom) decreased in the period 1975 - 90 (tab 1). This was the case for both boys and girls. In the period 1990 - 2000 the decrease levelled off, and there were instances of increase in these grades. Among boys in 10th grade the pattern was about the same, but with a temporary increase in experimental smoking already between 1980 and 1985. Among girls in the 10th grade the patterns were again similar, but with a temporary increase in experimental smoking which took place between 1985 and 1990.
|
Table 1 Smoking habits by grade, sex and age
|
|
|
Boys
|
|
Girls
|
|
|
Smoke daily
|
Sometimes or very seldom
|
Never
|
Total
|
|
Smoke daily
|
Sometimes or very seldom
|
Never
|
Total
|
|
Grade
|
Year
|
%
|
%
|
%
|
n
|
|
%
|
%
|
%
|
n
|
|
8.
|
1975
|
6.5
|
28.6
|
64.9
|
886
|
|
7.0
|
29.0
|
64.1
|
860
|
|
1980
|
6.1
|
17.1
|
76.8
|
957
|
|
4.4
|
14.5
|
81.1
|
887
|
|
1985
|
3.1
|
15.2
|
81.7
|
862
|
|
2.8
|
13.7
|
83.5
|
869
|
|
1990
|
2.4
|
8.9
|
88.8
|
721
|
|
1.4
|
9.3
|
89.3
|
691
|
|
1995
|
2.4
|
9.6
|
87.2
|
705
|
|
2.8
|
13.4
|
83.8
|
649
|
|
2000
|
3.6
|
10.9
|
85.4
|
631
|
|
2.8
|
12.4
|
84.8
|
639
|
|
2005
|
1.0
|
3.6
|
95.4
|
834
|
|
1.2
|
4.0
|
94.8
|
775
|
|
9.
|
1975
|
16.4
|
29.2
|
54.4
|
928
|
|
16.5
|
34.1
|
49.4
|
856
|
|
1980
|
13.0
|
23.1
|
63.9
|
900
|
|
10.9
|
24.0
|
65.0
|
932
|
|
1985
|
11.0
|
17.4
|
71.6
|
901
|
|
10.4
|
16.7
|
72.9
|
819
|
|
1990
|
6.8
|
15.1
|
78.1
|
761
|
|
7.8
|
16.9
|
75.3
|
669
|
|
1995
|
7.1
|
16.2
|
76.7
|
678
|
|
8.5
|
20.3
|
71.2
|
681
|
|
2000
|
8.7
|
18.5
|
72.7
|
653
|
|
12.2
|
21.8
|
66.0
|
583
|
|
2005
|
5.2
|
6.7
|
88.1
|
822
|
|
4.1
|
9.9
|
85.9
|
774
|
|
10.
|
1975
|
22.6
|
23.8
|
53.6
|
841
|
|
28.4
|
30.3
|
41.4
|
790
|
|
1980
|
21.5
|
20.3
|
58.2
|
893
|
|
20.6
|
25.7
|
53.7
|
849
|
|
1985
|
21.0
|
22.0
|
57.0
|
856
|
|
19.0
|
20.0
|
61.0
|
823
|
|
1990
|
17.1
|
14.3
|
68.7
|
750
|
|
19.8
|
22.8
|
57.4
|
712
|
|
1995
|
13.9
|
19.2
|
66.8
|
733
|
|
16.6
|
25.4
|
58.1
|
658
|
|
2000
|
15.7
|
17.7
|
66.6
|
592
|
|
18.0
|
24.4
|
57.6
|
561
|
|
2005
|
8.5
|
12.0
|
79.5
|
815
|
|
9.5
|
15.3
|
75.3
|
793
|
From 2000 to 2005, smoking decreased strongly for all three classes in secondary school. The proportion of daily smokers in 10th grade decreased from 15.7 % to 8.5 % for boys and from 18.0 % to 9.5 % for girls. The decrease in smoking over the entire period 1975 - 2005 was statistically significant both for boys and girls in all grades and irrelevant of how one defines smoking (all χ2-tests for trend p < 0.001) (fig 1).
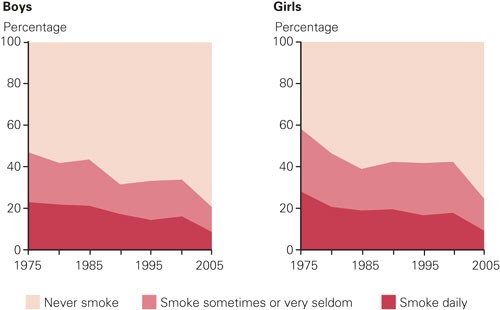
Figure 1 Smoking habits by year and sex. Pupils in 10th grade
The proportions of daily smokers in 8th and 9th grades were quite low during the entire period. We have therefore chosen to present changes in mean weekly use of cigarettes among daily smokers in 10th grade only. This showed quite small variation in the period 1975 - 2000 and was all the time higher among boys than girls. From 2000 to 2005 the usage increased from 50 to 64 cigarettes per week among boys and from 43 to 47 among girls. This increase was statistically significant only for the boys (p = 0.011).
Use of snus
Among girls, the proportion that used snus daily was very low (0 - 0.5 %) for all grades during the entire period (1985 - 2005). The proportion of 10th grade girls that used snus sometimes or very seldom increased markedly from 2000 to 2005 (from 2.4 % to 9.4 %). Among boys, snus was most widespread in the 10th grade. There was a decrease in the proportion of boys that used snus from 1985 to 1990 and thereafter an increase up to 2005, when the proportion using snus daily was almost as high as for daily smoking (7.9 % versus 8.5 %). The proportion of boys in 10th grade that used snus sometimes or very seldom was 21.1 % in 2005. Among boys in the 9th and 10th grade, there were significant increases in the use of snus in the period 1990 to 2005, irrespective of how use of snus is defined (all χ2-tests for trend p <0.05) (tab 2).
|
Table 2 Use of snus by grade, sex and year
|
|
|
Boys
|
|
Girls
|
|
|
Use snus daily
|
Sometimes or very seldom
|
Never
|
Total
|
|
Use snus daily
|
Sometimes or very seldom
|
Never
|
Total
|
|
Grade
|
Year
|
%
|
%
|
%
|
n
|
|
%
|
%
|
%
|
n
|
|
8.
|
1985
|
0.5
|
9.3
|
90.2
|
860
|
|
0.5
|
1.0
|
98.5
|
869
|
|
1990
|
0.0
|
4.6
|
95.4
|
723
|
|
0.0
|
0.7
|
99.3
|
689
|
|
1995
|
0.3
|
4.1
|
95.6
|
702
|
|
0.2
|
1.1
|
98.8
|
649
|
|
2000
|
1.1
|
5.8
|
93.1
|
565
|
|
0.2
|
1.2
|
98.7
|
599
|
|
2005
|
0.5
|
4.2
|
95.3
|
831
|
|
0.0
|
1.3
|
98.7
|
773
|
|
9.
|
1985
|
2.0
|
15.0
|
83.0
|
908
|
|
0.0
|
3.1
|
96.9
|
816
|
|
1990
|
1.7
|
7.9
|
90.4
|
759
|
|
0.0
|
1.9
|
98.1
|
667
|
|
1995
|
1.3
|
10.0
|
88.6
|
678
|
|
0.1
|
1.9
|
97.9
|
681
|
|
2000
|
3.5
|
13.8
|
82.7
|
594
|
|
0.2
|
1.6
|
98.2
|
553
|
|
2005
|
3.1
|
11.9
|
85.0
|
815
|
|
0.1
|
4.3
|
95.6
|
772
|
|
10.
|
1985
|
7.0
|
18.1
|
74.9
|
855
|
|
0.1
|
4.7
|
95.2
|
827
|
|
1990
|
2.7
|
12.6
|
84.7
|
745
|
|
0.0
|
3.8
|
96.2
|
712
|
|
1995
|
3.3
|
16.2
|
80.5
|
729
|
|
0.2
|
4.1
|
95.7
|
657
|
|
2000
|
5.1
|
17.3
|
77.6
|
549
|
|
0.2
|
2.4
|
97.4
|
535
|
|
2005
|
7.9
|
21.2
|
70.9
|
812
|
|
0.3
|
9.4
|
90.4
|
789
|
Of the boys in 10th grade, 14 % used tobacco (smoked or used snus) daily in 2005. Those who only smoked daily without using snus daily constituted 6.1 %. Those who used snus daily, but did not smoke daily, made up 5.4 %. The smallest group consisted of those who both smoked and used snus daily (2.5 %) (tab 3).
|
Table 3 Daily smoking and daily use of snus by year and sex among pupils in the 10th grade
|
|
|
Smoke daily, use snus daily
|
Smoke daily, do not use snus daily
|
Do not smoke daily, use snus daily
|
Do not smoke daily, do not use snus daily
|
|
Year (n)
|
%
|
%
|
%
|
%
|
|
Boys
|
1985 (852)
|
1.6
|
19.2
|
5.3
|
73.8
|
|
1990 (745)
|
0.8
|
16.1
|
1.9
|
81.2
|
|
1995 (729)
|
1.4
|
12.6
|
1.9
|
84.1
|
|
2000 (548)
|
1.8
|
13.0
|
3.3
|
81.9
|
|
2005 (809)
|
2.5
|
6.1
|
5.4
|
86.0
|
|
Girls
|
1985 (822)
|
0.1
|
18.9
|
0.0
|
81.0
|
|
1990 (712)
|
0.0
|
19.8
|
0.0
|
80.2
|
|
1995 (656)
|
0.2
|
16.3
|
0.0
|
83.5
|
|
2000 (532)
|
0.2
|
17.7
|
0.0
|
82.1
|
|
2005 (789)
|
0.0
|
9.5
|
0.3
|
90.2
|
The proportion of 10th grade boys that used tobacco at all (daily, sometimes or seldom) was 49.6 % in 1985. This was reduced to 34.1 % in 2005 (not shown in table). The proportion that only smoked without using snus was reduced more drastically, from 24.5 to 4.9 %. Among the girls in the 10th grade, 40 % used tobacco in 1985. The proportion that only smoked, without using snus, was much higher among girls than among boys, i.e. 16.7 %. The reduction among pupils in the 10th grade in the proportion that used tobacco in the period 1985 to 2005 was significant for both sexes, irrespective of how one defines tobacco use (all χ2-tests for trend p < 0.001).
The association between use of snus and smoking
Use of snus was particularly common among boys in the 10th grade in 1985 and among boys in the 10th grade in 2005. We have therefore used these two groups to examine changes in the association between smoking habits and use of snus. The association between smoking habits and use of snus changed significantly from 1985 to 2005 (p < 0.001). In 1985 the proportion that used snus daily among those who never smoked was 2.7 %; it was 17.2 % for those who smoked «sometimes» or «very seldom» and 7.9 % among those who smoked daily. The proportion that used snus daily was highest among experimental smokers. In 2005, the association was different. The proportion that used snus daily in the same three groups was 2.8 %, 27.4 % and 29.0 %. The proportion that used snus daily had increased among the experimental smokers, but even more among daily smokers. While daily use of snus in 1985 for many might have been an alternative to daily smoking, in 2005 the use of snus was more strongly associated with smoking. This was the case despite the fact that smokers reported smoking a higher number of cigarettes in 2005 than in 1985. Experimental snus use was more common among daily smokers and among experimental smokers in 2005 than in 1985 (tab 4).
|
Table 4 Use of snus by smoking habits among boys in the10th grade, 1985 and 2005
|
|
|
Use snus daily
|
Use snus sometimes or very seldom
|
Never use snus
|
|
Year
|
Smoking habits (n)
|
%
|
%
|
%
|
|
1985
|
Smoke daily (178)
|
79
|
39.9
|
52.2
|
|
Smoke sometimes or very seldom (186)
|
17.2
|
20.4
|
62.4
|
|
Never smoke (488)
|
2.7
|
9.4
|
87.9
|
|
2005
|
Smoke daily (69)
|
29.0
|
56.5
|
14.5
|
|
Smoke sometimes or very seldom (95)
|
27.4
|
41.1
|
31.6
|
|
Never smoke (645)
|
2.8
|
14.6
|
82.6
|
No significant difference was found in the mean consumption of cigarettes between those who smoked daily and those who in addition used snus daily (examined for boys in the 10th grade in 1985 and 2005).
Discussion
Changes in smoking habits
The prevalence of smoking was lower in 2005 than in 1975. The decrease in the intervening period was, however, far from linear. In the 1990s there were instances of increase. The patterns of change were not identical across sex and grades. The decrease in the prevalence of smokers stopped during a period and even increased a little; this was probably neither caused by changes in cigarette prices nor in buying capacity. Cigarette prices continued to increase in the 1990s and the buying power was similar to that in the period before and after (8). It is therefore possible that the flattening can be explained by reduced preventive efforts.
The decrease in smoking from 2000 to 2005 is remarkable. If one sees all three grades in secondary school and both sexes in one, the proportion of daily smokers in secondary school decreased from about 10 % to about 5 % in this period. At the first National (Norwegian) Tobacco Conference in 2002, Health Minister Dagfinn Høybråten launched the goal to halve smoking among adolescents during the next 5-year period. His ambitious goal proved to be realistic.
There are several explanations for this reduction in prevalence of smokers among adolescents. In the period we have studied, there was a substantial decrease in smoking also among adults. As young people’s smoking habits are much affected by those of their parents; the fact that fewer parents were smokers in 2005 than in 2000 may be an explanation for the decrease. A logical next question will then be what may have caused this decrease among adults. The strong political signals against smoking when Høybråten was Minister of Health may have contributed to the decrease. From 2003, more powerful measures than those previously used in the Norwegian smoking control programme were introduced, and there was an increase in the use of mass media campaigns. Researchers at the Norwegian Institute for Alcohol and Drug Research (SIRUS) suggested and advocated that campaigns with more use of fear appeals would be effective in reducing smoking. This was well received by politicians, and a campaign containing straightforward and realistic descriptions of health consequences of smoking was launched in 2003. It proved to be controversial, but may have contributed to changing attitudes to smoking and social norms related to smoking. The total ban on smoking in restaurants and bars, which came into force June 1st 2004, probably also contributed to the reduction in smoking. Public debates on the introduction of the total ban on smoking may well have contributed to raise awareness and disseminate health information.
Last, but not least, it should be mentioned that the decrease in smoking from 1975 to 1985 (among girls) and the decrease in the period 2000 to 2005 (both sexes), may be associated with campaigns in secondary school. Towards the end of the 1970s, the Norwegian Council on Smoking and Health produced an educational programme about smoking and health that was used by schools nationwide (9), and in the 1990s the Norwegian Cancer Society developed a programme that was later distributed by the Directorate of Health and Social Affairs (BE smoke FREE). Evaluation of this last programme showed that the proportion of daily smokers among pupils by the end of grade 10 was reduced by about one third (10). A study which showed that many schools used only parts of the programme led to development of a revised version that is easier to implement and which is easier to integrate in the schools’ teaching plans (11). This newest version of the programme is called FREE.
Snus - an alternative to smoking?
Another obvious explanation of the decrease in smoking is the increased use of snus that has been shown in this study. If the more recent changes have followed the trend which was shown for the period 2000 - 2005, there is currently a larger proportion of adolescents that use snus daily than the proportion that smoke daily. It is likely that snus use is less health- damaging than cigarette smoking (12), but the authorities have not actively recommended snus use as an alternative to smoking. However, the mass media have communicated such ideas. These signals may have affected the general public and led some adolescents to use snus instead of starting to smoke. One possible explanation of the lower frequency of smoking in Sweden compared with most other countries is that snus use is so common in the Swedish population (13).
If snus does not serve as a supplement to smoking, but as an alternative, one could imagine that there was a negative association between the two. In that case, only a few of those who smoked would use snus, and among those who used snus only a few would smoke. However, if snus does not replace smoking but rather functions as another source of nicotine for those who already smoke, one would expect a positive association - i.e. those who smoke should also have an elevated risk of using snus and vice versa. In the present study we found that the association between smoking and snus use had changed from 1985 to 2005. In 2005, snus was used more in conjunction with smoking. So, it seems like snus use in 2005 functions more as a supplement than an alternative to smoking.
Studies with a different design are needed before we can draw more firm conclusions on the role of snus use in reducing smoking rates. One can for example study whether those who try to stop smoking by starting to use snus succeed better than those who try without. A randomised design (if approved by relevant ethical committees) would be preferable. Further, one could examine to what extent adolescents who use snus have a tendency to also start smoking, or whether it is more common to use snus regularly without starting to smoke.
Strengths and weaknesses of the study
The study is based on a comprehensive material that has been collected through investigations among pupils over a long period of time. This provides opportunities to examine changes in smoking habits and use of snus in a most interesting population segment, namely the age groups where much of the recruitment for use of tobacco has traditionally taken place. The large samples, use of identical questions and identical response categories to register behaviour over time, strengthen the study. Changes that were made to the questionnaire during the study did not affect the questions that have been used as a basis for analyses in this article. One has also used a standard approach for collection of data in the class; a text is read aloud by the teacher before the pupils fill in the forms and a procedure is in place to ensure anonymity of the pupils.
When this series of smoking studies were started among Norwegian pupils in 1975, one used the same questions and response categories to map the pupils’ smoking habits that the Norwegian Cancer Society did in their studies in the 1950s and 60s. This was done to ensure comparability over time. The response categories we therefore had to use for registration of smoking frequency have one weakness. It is fine that one has a separate category to register daily use, but the category «sometimes or very seldom» is too broad and vague. One should instead use the same response categories as those in the Health Behaviour in School age Children Study (HBSC) (14): «every day», «every week», «more seldom than once a week» and «not at all». It is important to measure weekly smoking as the development to daily smoking often goes through party smoking during weekends. It is also more logical that the last category is «not at all» rather than «never», as «never» may mean that one has never tried to smoke. The purpose of this question is not to map smoking in the past, but rather present behaviour.
Participation in the study in the school year 2000/01 was somewhat lower than for other years. If attrition was associated with smoking habits, we would expect that smokers would be overrepresented among those who dropped out of the study. If that was the case, the proportion of smokers in 2000 was underestimated. The increase in proportion of daily smokers towards the end of the 1990s and the decrease from 2000 to 2005 may therefore be even stronger than shown by our data.
