To understand the development in cardiovascular diseases it is useful to monitor the incidence of myocardial infarction. However, due to the lack of an adequate register of diseases in Norway, the incidence has not been known. The Norwegian Patient Register (NPR), which is based on patient administrative data from Norwegian hospitals, has given a complete record since 1991. However, the data in the Register were not patient-identifiable before 2007 and could provide only limited information about incidence trends. Nevertheless, our analyses of NPR data indicate that the incidence of myocardial infarction in the population under the age of 80 fell sharply in the 1990s, while those over 80 suffered a greater number of myocardial infarctions in this period (1, 2). Our latest analyses indicate that the incidence in age groups under 80 continued to show a downward trend in the 2000s in line with the preceding decade (3).
We wanted to collate these findings with the trend in myocardial infarction mortality up to recent years. The trend in mortality rates for the oldest age groups is of particular interest because earlier studies of Norwegian data have not included this.
Materials and methods
Data were obtained from Statistics Norway’s Cause of Death Register covering the period from 1969 to 2007. The data were analyzed by the authors. The selection was based on the following codes: period from 1969 – 85: ICD-8-code 410; period from 1986 – 95: ICD-9-code 410; period from 1996 – 2004: ICD-10-codes I21 and I22; period from 2005 – 07: ICD-10-code I21. The change in the selection between 2004 and 2005 is because from 2005 onwards all deaths from myocardial infarction were classified under code I21. A more detailed presentation of cause of death statistics can be found on SSB’s website (4).
Mortality rates (deaths per 100 000 inhabitants) for acute myocardial infarction were calculated for the population as a whole, by sex, and by 10-year age groups for the age range 40 – 79, and also for age groups 40 – 79 and 80 years and above.
Results
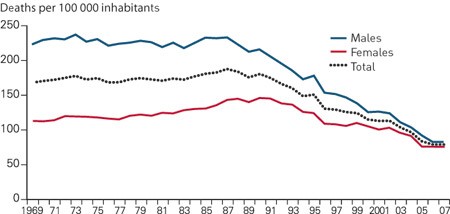
Total myocardial infarction mortality increased slightly in the 1970s and 1980s, reaching a peak in 1987 (189 deaths per 100 000 inhabitants) (fig 1). The increase in total mortality in this period is due to the increase in mortality for females. Total mortality declined from1987 to 2007, when we observed the lowest level in the period of analysis (79.7 deaths per 100 000 inhabitants). Total mortality was more than halved in the 20-year period after 1987. The decline in mortality was stronger for males (– 64 %) than for females (– 47 %) in this period. In 2007 total myocardial infarction mortality (not adjusted for age) among males was 9 % higher than among females.

Figure 1 Mortality rates for myocardial infarction (deaths per 100 000 inhabitants) in total and by sex, 1969 – 2007
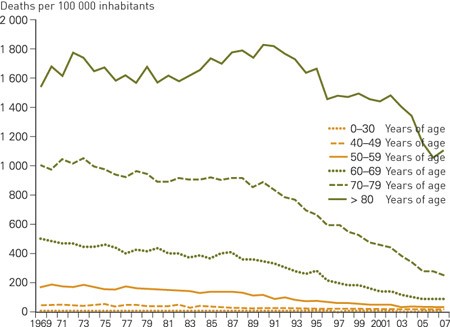
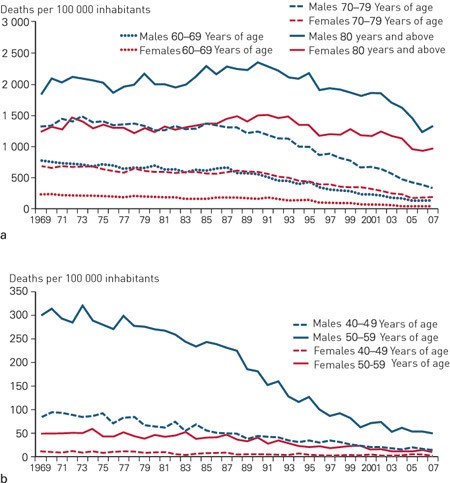
In the age groups below 70, mortality fell during the entire period of analysis (fig 2, fig 3). For example, in the 60 – 69 age group mortality was reduced from approximately 500 per 100 000 inhabitants in 1969 (783 per 100 000 inhabitants for males and 241 per 100 000 inhabitants for females), to 85 per 100 000 inhabitants in 2007 (127 per 100 000 inhabitants for males and 35 per 100 000 inhabitants for females). For the 70 – 79 age group, mortality decreased from roughly 1 000 per 100 000 inhabitants in the early 1970s to approximately 900 in 1990. In the ensuing period we observed a stronger decline. Mortality fell by 70 % for this age group from 1990 to 2007. For the group aged 80 and over, mortality increased from the early 1980s up to 1991and subsequently showed a considerable decrease. From 1990 to 2007, we observed a 40 % decline in mortality with a greater decline for males than females (the estimate for trend variables for males and females shows a significant difference at the 0.01-level).

Figure 2 Mortality rates for myocardial infarction (deaths per 100 000 inhabitants) by age group, 1969 – 2007

Figure 3 Mortality rates for myocardial infarction (deaths per 100 000 inhabitants) by sex and by age group, 1969 – 2007. a) Age groups 60 and over, b) Age groups 40 – 59
The strong decline in mortality was characterized by a degree of age-related time lag. We can trace the beginning of this decline for the youngest age groups to the early 1980s, while for middle-aged groups the decline started later in the 1980s and for the group aged 80 and over, the trend commenced in the early 1990s.
Discussion
Prior to our period of analysis, the years from 1950 to 1970 saw a dramatic development with mortality from ischemic heart diseases nearly doubling for the 40 – 69 age group (5). The positive trend in recent decades is no less dramatic, with a formidable reduction in myocardial infarction mortality. In recent years mortality for the under 80s has remained at only 20 – 30 % of its level at the beginning of the 1970s. This is a gratifying development which has exceeded all expectations. The findings are in keeping with our recently published analyses, which indicate that the incidence of myocardial infarction has also fallen considerably in the 1990s and 2000s (3). With mortality rates showing a downward trend also for the oldest group, it is clear that the favourable development has taken place in all age groups.
The reasons for the time lag – that the strong decline in mortality began first among the youngest group and last in the oldest group – may be that a more favourable risk profile, better medication and a more effective invasive treatment strategy first had an impact on the youngest age groups. An improved and swifter response among the youngest groups may well be related to a lesser degree of subclinical atherosclerosis in the coronary arteries. If the disease process has not started in the vessel wall, an improved profile of the modifiable risk factors might provide a better effect. The deferral of myocardial infarction to a higher age is part of the successful campaign against cardiovascular diseases (1, 2) and may have contributed to the age gradient. It is also likely that improved medication and invasive treatment was offered to younger age groups first, which may have led to a reduction of mortality in these groups first. We observed an earlier and more extensive use of percutaneous coronary intervention (PCI) in the younger groups (data not shown).
Moreover, there are complex reasons for the lower incidence of coronary heart disease in Western countries. An American study attempted to estimate the contribution of various input factors and concluded that a more favourable risk profile and improved treatment had both played an almost equally important role (6). The findings of a Swedish study showed that just over half the reduction in mortality from 1986 to 2002 could be attributed to a more favourable profile for the classic risk factors and approximately one-third was due to improved individual treatment (7). In the period from 1972 to 2007, Finland reported an 80 % decline in mortality from coronary heart disease in males aged 25 – 74, and the change in risk factors – cholesterol level, blood pressure and smoking – could explain a 60 % decline in mortality (8).
How does myocardial infarction mortality in Norway compare with other countries? Norway has long been classified as a high-risk country but the decline in mortality around 2000 placed the country on approximately the same level as Greece and not far behind the Mediterranean countries of France, Italy and Spain, which are the countries with the lowest mortality from cardiovascular diseases (9). In Denmark and Sweden the development has been almost the same as in Norway while Finland, where there was initially a very high level of myocardial infarction, continued to have somewhat higher mortality rates than neighbouring countries in 2000 (9, 10). It will be exciting to see whether comparisons for recent years show a further decline in the differences.
In Europe, tables based on the American Framingham Heart Study (11) were used previously for the estimation of individual risk, but over time these were deemed to be less suited. Instead so-called SCORE-tables were introduced in 2003 (12). Norwegian data material constitutes part of the database for the SCORE tables that are applicable to the high-risk countries among which Norway has always been classified. However, the Norwegian patient data included in the SCORE project were collected several decades ago, and in recent years it has been suggested that they overestimate cardiovascular mortality and are thus less applicable (13). A new system, the NORRISK-model, has been introduced and is proposed as an improved tool in risk evaluation (14).
Our results concern myocardial infarction mortality but in some contexts it is of interest to examine statistics for the entire cardiovascular field. Myocardial infarction constitutes the largest group, but over the last decades mortality from cerebral stroke – the next largest group – has also diminished considerably (9, 15).
Overall we have witnessed a surprisingly positive trend in Norway. However, there is no reason to rest on our laurels. This trend might be reversed, particularly because there is considerable uncertainty regarding how the «epidemic» of inactivity/obesity will affect mortality rates from a long-term perspective. All-out efforts to combat cardiovascular diseases are still essential.