Old Drupal 7 Site

Notification of highly abnormal laboratory results to doctors outside hospitals

Kristin M. Aakre, Gunhild Garmo Hov, Øyvind Skadberg, Armin Piehler, Sonia Distante, Helle B. Hager About the authors
Artikkel

A large number of biochemical analyses are ordered daily from Norwegian laboratories by GPs and specialists in private practice. The analytical results often become available at times when medical offices are closed, and from time to time severely pathological results are discovered. If these may imply a life-threatening situation, the laboratory has an obligation to issue an alert. There is normally local agreement on how this alert should be issued, but there is no clear consensus on how abnormal the analyte concentrations need to be for an alert to be issued. This question was taken up in 2011 at the annual meeting of the Norwegian Clinical Chemistry EQA program (NKK; the organisation that provides external quality control for Norwegian laboratories). It emerged there that the practices of Norwegian laboratories with regard to issuing alerts about abnormal analytical results vary considerably. Articles in international publications show similar variations between laboratories (1 – 10). The Norwegian Society for Medical Biochemistry accordingly established a national working group in January 2012 consisting of six doctors from as many different laboratories, who were to give recommendations for when analytical results should be immediately reported to the ordering doctor or his or her representative.

Method

The working group evaluated the critical limits used by Norwegian laboratories in 2011, the limits that Norwegian GPs recommended the laboratories to use (separate questionnaire) and the limits described in international literature, and attempted to find scientific documentation for concentrations indicating that life or health is at risk. The resource expenditure associated with the choice of different limits was also calculated. The authors have used the various data collected in addition to their own experience/critical assessment and arrived at consensual recommendations. The working group’s final proposal for critical limits (Table 1) was adjusted after it had been circulated for comments among the members of the Norwegian Society for Medical Biochemistry and the Board of the Association of General Practitioners.

Table 1.  The table shows the biochemical analyses and critical limits for which the working group proposes that the laboratories immediately alert medical personnel responsible for treatment. The proposal applies only to adult patients. D-dimer analysis is used in a variety of ways. The laboratories who offer this test to GPs should consider introducing a critical limit for alerts based on local practice.

Low values

High values

Glucose, mmol/l

23.0.

Sodium, mmol/l

120

155

Potassium, mmol/l

2.5

6.2

Calcium, mmol/l

1.80

3.20

Ionised calcium, mmol/l

0.80

1.60

Phosphate, mmol/l

0.3

Magnesium, mmol/l

0.5

2.0

Creatinine, μmol/l

400**

eGFR, ml/min/1.73m²

15**

Carbamide, mmol/l

40**

Haemoglobin, g/l

7.0

Leukocytes, 10⁹/l

1.5

50.0**/100.0

Neutrophil granulocytes 10⁹ l

0.50

Blasts, smear

If acute leukaemia is suspected

Thrombocytes, 10⁹/l

20

1500

INR

6.0/5.0 (before Friday)

D-dimer, mg/l

Local limit should be considered

Troponin T / I, ng/l

50/50

CK, creatine kinase, U/l

10000

s-Cortisol (morning), nmol/l

75

[i] [ii]

[i] * this value is used if albumin-adjusted calcium is available

[ii] ** alert required only on the first observation

Collection of critical limits used at Norwegian laboratories

Prior to NKK’s annual meeting in 2011, the laboratories that participate in NKK (in practice, all Norwegian laboratories that perform analyses ordered by the primary health service) were asked to send their procedures for notification of abnormal analytical results to one of the speakers at the meeting (KMA). The critical limits used were then summarised (Table 2).

Table 2.  Critical limits for various biochemical analyses; median values and range for the limits used at 42 Norwegian laboratories. The percentages of laboratories that issued alerts for the various analyses are given in columns 2 and 5

Low values

High values

 %

Median

Range

 %

Median

Range

Glucose, mmol/l

95

2.0

2.0 – 3.0

98

20

14 – 30

Sodium, mmol/l

91

120

115 – 130

85

160

150 – 165

Potassium, mmol/l

95

2.5

2.0 – 3.0

93

6.0

5.5 – 6.6

Chloride, mmol/l

10

78

75 – 85

10

123

120 – 125

Calcium, mmol/l

93

1.8

1.5 – 2.0

93

3.0

2.8 – 3.5

Ionised calcium, mmol/l

33

0.90

0.78 – 1.00

33

1.55

1.50 – 1.60

Phosphate, mmol/l

19

0.3

0.3 – 0.5

14

2.9

2.90 – 3.00

Magnesium, mmol/l

48

0.5

0.4 – 0.5

38

2.00

1.30 – 3.00

Urate, μmol/l

10

778

750 – 800

Creatinine, μmol/l

83

550

200 – 1000

Carbamide, mmol/l

26

25

15 – 40

Iron, μmol/l

19

60

50 – 70

CRP, mg/l

43

200

175 – 350

Albumin, g/l

12

18

15 – 20

Haemoglobin, g/l

93

7.0

6.5 – 9.0

45

20

17 – 22

Leukocytes, 10⁹/l

95

2.0

1.0 – 3.5

79

30

20 – 100

Neutrophil granulocytes 10⁹ l

69

0.5

0.4 – 1.0

Thrombocytes, 10⁹/l

100

30

15 – 100

29

1000

700 – 1000

INR

88

4.9

4.0 – 7.0

D – dimer, mg/l

26

4

Pos – 20

APTT, s

45

150

75 – 200

Fibrinogen, g/l

45

1.0

0.2 – 2.0

12

10.0

6.0 – 12.0

Antithrombin, %

14

70

50 – 80

Troponin T, ng/l*

45.

30

14 – 5000

Troponin I, ng/l*

17.

40

28 – 100

CK, creatine kinase, U/l

31

6000

400 – 10000

Amylase, U/l

26

300

150 – 1500

Lipase, U/l

10

1250

150 – 1500

ALT, U/l

10

400

300 – 5000

Creatinine, μmol/l

14

300

50 – 350

Free T4, pmol/l

36

50

40 – 100

TSH, mIE/l

8

45

40 – 100

Free T3, pmol/l

10

20

20 – 20

Cortisole, nmol/l

12

75

50 – 100

Osmolality, mosm/kg

12

250

240 – 250

12

330

330 – 340

pH

21

7.20

7.10 – 7.20

21

7.58

7.55 – 7.60

pCO₂, kPa

10

2.60

2.50 – 2.70

17

10.00

9.00 – 10.00

pO₂, kPa

12

6.00

5.00 – 7.00

[i]

[i] * 19 and 7 of 42 laboratories had critical limits for TnT and TnI, respectively; a total of 62 % had a critical limit for troponins

Gathering of data from general practice

In autumn 2011 a pilot study was conducted among 155 GPs who attended two courses arranged by the Norwegian Quality Improvement of Primary Health Care Laboratories (NOKLUS). The doctors were sent a questionnaire and asked to specify critical (alert) limits for 31 different analyses. The primary aim of this survey was to find what limits should trigger a notification when medical offices were closed. On the basis of the data from the pilot study, the working group developed a new questionnaire in which respondents were asked to give critical limits for the 15 analyses that were regarded as most relevant. The form also contained questions regarding the GPs’ view of this service, and who they thought the laboratory should contact if the doctor who ordered the tests was not available. The form was sent to 1173 GPs who ordered laboratory analyses from the following laboratories: Haukeland University Hospital, Fürst Medical Laboratory, St. Olav’s Hospital, Vestfold Hospital, Stavanger University Hospital and Oslo University Hospital (from 85 to 330 ordering doctors at the different laboratories). No reminders were sent. Twenty one forms were returned unopened. The data from the two surveys were analysed separately by means of descriptive statistics (Table 3).

Table 3.  A number of Norwegian GPs were asked to specify critical limits for 15 different biochemical analyses. The table shows the percentages who specify critical limits, as well as median values and 10 and 90 percentiles for proposed critical limits. This table includes the results of the pilot study. Where there is a discrepancy between median values in the main survey (N = 302) and the pilot study (N = 51) the results of the pilot study are given in brackets. The units for the analyses are as given in Tables 1 and 2.

Low values

High values

 %

Median

10 – 90 percentile

 %

Median

10 – 90 percentile

Glucose

32

2.5 (2.0)

2.0 – 3.0

42

20.0

10.0 – 25.0

Sodium

49

126 (125)

120 – 132

34

150

150 – 160

Potassium

57

3.0

2.5 – 3.3

65

6.0

5.0 – 6.5

Calcium

31

2.00

1.80 – 2.10

39

2.80 (2.90)

2.60 – 3.10

Creatinine

44

201 (300)

150 – 400

CRP

35

120 (150)

50 – 200

Haemoglobin

44

8.0 (7.0)

6.0 – 9.0

15

19.0

18.0 – 20.0

Leukocytes

43

2.0

1.0 – 3.0

39

20.0

12.0 – 30.0

Thrombocytes

46

50

20 – 100

17

600 (500)

425 – 1000

INR

37

5.0

4.0 – 7.0

D-dimer

18

1.0

1.0 – 5.0

Troponin T

54

15 (30)

10 – 32

Troponin I

45

30

30 – 50

CK, creatinine kinase

25

950 (1000)

319 – 4000

Free T4

20

6.0

4.0 – 9.0

30

30.0

24.1 – 49.0

Literature search

A literature search of PubMed was performed to determine the critical (alert) limits that are used for laboratory analyses. The reference lists in the articles identified were then searched manually (Table 4). In the case of several of the analyses, a literature search was also performed to determine whether there was scientific documentation for maintaining that given concentrations of an analyte can cause an acute health risk requiring treatment.

Table 4  gives the laboratory values that are used as critical limits for adult patients in studies identified following a non-systematic search in PubMed, and a manual search through references in these articles (1 – 10). The number of studies that recommend critical limits for the various analyses are shown in column 2, while columns 3 and 4 show the range of average values (or median values if these are given) for the critical limits that are given in the various studies.

Analyte

Number

Lower limit

Upper limit

Glucose, mmol/l

7

2.1 – 2.5

20.7 – 28.0

Sodium, mmol/l

7

119 – 123

153 – 160

Potassium, mmol/l

8

2.3 – 2.8

6.0 – 6.2

Chloride, mmol/l

6

74 – 85

115 – 126

Calcium, mmol/l

8

1.49 – 1.70

3.00 – 3.30

Ionised calcium, mmol/l

4

0.74 – 0.80

1.58 – 1.60

Phosphate, mmol/l

6/5

0.29 – 0.39

2.61 – 2.91

Magnesium, mmol/l

8

0.39 – 0.50

1.78 – 2.11

Urate, μmol/l

5

700 – 790

Creatinine, μmol/l

6

381 – 654

Carbamide, mmol/l

6

25 – 37

Albumin, g/l

1

15

Haemoglobin, g/l

8

5.0 – 7.0

19.9 – 20.1

EVF

2

0.20

0.60

Leukocytes, 10⁹/l

7

1.9 – 3.0

30 – 50

Thrombocytes, 10⁹/l

9

19 – 40

900 – 1000

PT-INR

5

NA

NA/ 6.2

D-dimer, mg/l

1

Positive

APTT, Cepotest, s

6

NA

Fibrinogen, g/l

5/4

0.8 – 1.0

8.0 – 8.1

Troponin T, μg/l

2

0.1/cut off for myocardial infarction

CK, creatine kinase, U/l

1

1000

Myoglobin, mg/l

1

110

Amylase, U/l

1

394

Lipase, U/l

1

700

ALT, AST, U/l

1

1000

Bilirubin, μmol/l

5

257 – 299

Osmolality, mosmol/kg

2

250

325

pH

2

7.2

7.6

PCO₂, kPa

2

2.7

9.3

PO₂, kPa

1

5.3

Bicarbonate, mmol/l

1

12

39

Total carbon dioxide, mmol/l

2

10

40

Ammonia, mmol/l

1/2

4.3

44 – 60

Lactate, mmol/l

2

3.4

Glucose CSF, mmol/l

2

2.2

11.1

Workload associated with critical limits

The laboratory results ordered by about 600 primary care doctors and analysed at Stavanger University Hospital were examined for the period 1 January to 31 June 2012 with emphasis on the 17 analyses regarded as the most important for the laboratory to issue an alert about. These data were used to estimate the effect on the workload of laboratories and GPs of using various critical limits (Table 5).

Table 5.  The table shows how different stipulated critical limits will influence how many analytical results per 1000 reported require that medical personnel responsible for treatment be alerted. The units for the analyses are as given in Tables 1 and 2.

Critical limit (concentration)

Alerts/1000 results

Critical limit (concentration)

Alerts/1000 results

Glucose (n = 20580)

2.0

0.24

20†

1.55

2.5*

0.29

23

0.83

3.0**

1.12

25

0.39

Sodium (n = 52347)

120*

0.12

150**

0.52

123

0.44

155

0.25

126**

1.70

160*

0.12

Potassium (n = 57164)

2.5*

0.09

6.0†

1.12

2.7

0.40

6.2

0.66

3.0**

1.21

6.4

0.38

Calcium (n = 25236)

1.80*

0.59

2.80**

2.54

1.90

1.27

3.00*

0.24

2.00**

4.24

3.20

0.08

Phosphate (n = 6832)

0.4

0

2.7

0.15

0.5

0.29

2.9*

0.15

Magnesium (n = 6700)

0.4

0.30

2.0*

0

0.5*

1.34

Creatinine (n = 73694)

201**

7.86

400

0.57

550*

0.08

Carbamide (n = 22458)

25*

5.08

40

0.40

CRP (n = 16906)

120**

8.16

150

5.56

200*

2.90

Haemoglobin (n = 52406)

7.0*

0.48

19.0*

0.23

8.0**

1.32

20.0

0.11

Leukocytes (n = 44377)

1.5

0.79

20**

3.27

2.0†

1.49

30*

1.26

50

0.65

100

0.27

Thrombocytes (n = 25800)

20

0.93

600**

4.69

30*

1.59

800

1.78

50**

3.45

1000*

1.05

PT-INR (n = 1475)

4.5

29.15

5.0†

17.63

6.0

7.46

D-dimer (n = 542)

1.0**

271.22

2.5

86.72

4.0*

12.92

Troponin I (n=598)

30**

68.56

50*

41.81

CK, creatine kinase, (n = 9682)

950**

4.34

6000*

0.21

10000

0.10

Free T4 (n=42331)

30.0**

2.27

40.0

0.78

50.0*

0.12

[i]

[i] * median critical limit from the laboratories

** median critical limit from the GPs

† median critical limit is the same for both GPs and laboratories

SPSS version 18.0 was used for the statistical analysis of the data.

Results

Notification procedures at Norwegian laboratories

Prior to the NKK meeting, written procedures for issuing notification of abnormal results were received from 42 laboratories. Two laboratories also reported that they issued notification of results from time to time, but that they did not have fixed limits or written procedures for doing so. A very large number of small laboratories are registered as participants in NKK, and it is not known how many of them perform laboratory analyses ordered by primary care doctors. All major laboratories (at regional or university hospitals) responded to the survey, however. Bearing in mind that there are about 50 hospitals in Norway that receive patients requiring acute care and that there is only one major private laboratory, it may be cautiously estimated that the survey response rate was over 80 %. The number of different biochemical analyses for which the laboratories had critical limits ranged from four to 38 (median 16.5). The limits used for those analyses that were reported by four or more laboratories are shown in Table 2. The limits used by the different laboratories varied widely. At 1 – 3 laboratories there were a total of 40 limits (high or low) that were only used at that particular laboratory. About half the laboratories had separate limits for children, and about the same number had separate limits for inpatients or limits that only applied to particular departments (for example oncological or haematological wards). These alert limits are not shown. A few (16 %) had different limits for different times of the day.

Advice from general practice

In the pilot study, 51 GPs responded (33 %), while 302 GPs (26 %) responded to the main study that was sent to doctors ordering analyses from six major Norwegian laboratories (the response rate varied from 16 % to 39 %). The results of the pilot study and the main study were largely consistent. Ninety per cent of the doctors reported that at least one analysis required notification. Electrolytes and some haematological parameters were most commonly indicated (see Fig. 1). The limits for immediate notification proposed by the doctors are shown in Table 2. Many doctors were uncertain as to whether the various test results required notification, and which limits should be used, which they indicated both by ticking the square «Don’t know» and by stating this in the comments field on the form. Even when doctors wanted to be alerted about a particular analyte (Fig. 1), they often did not want to suggest limits at which an alert should be issued (Table 3). This was particularly noticeable for one analyte (D-dimer); 45 % of doctors wanted to be notified, but far fewer (18 %) wanted to propose a critical limit themselves.

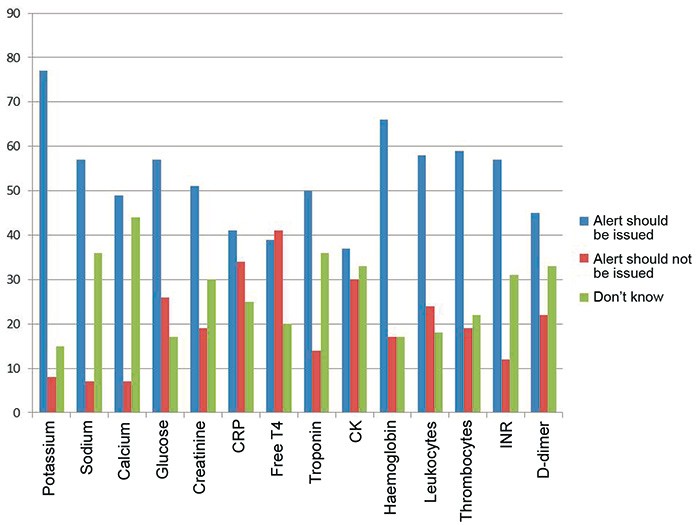
Figure 1  The percentage of GPs (n = 302) who believe that notification should or should not be given of pathological results for various biochemical analyses

In the main survey, the doctors were asked about their view of this type of service. Sixty-two per cent of the doctors had been contacted by a laboratory because of an abnormal test result, and they rated the benefit of this, on a scale from 0 (of no use at all) to 10 (very useful), as having an average value of 8.9. Fifty-four per cent had experienced that the laboratory contacted Accident and Emergency A&E or other medical personnel regarding an abnormal test result when they themselves were unavailable, and this service was rated as having an average value of 8.3 (same scale as above). Most GPs felt that the primary doctory, or failing that, A&E, should be notified if the laboratory discovers an abnormal test result (see Fig. 2).

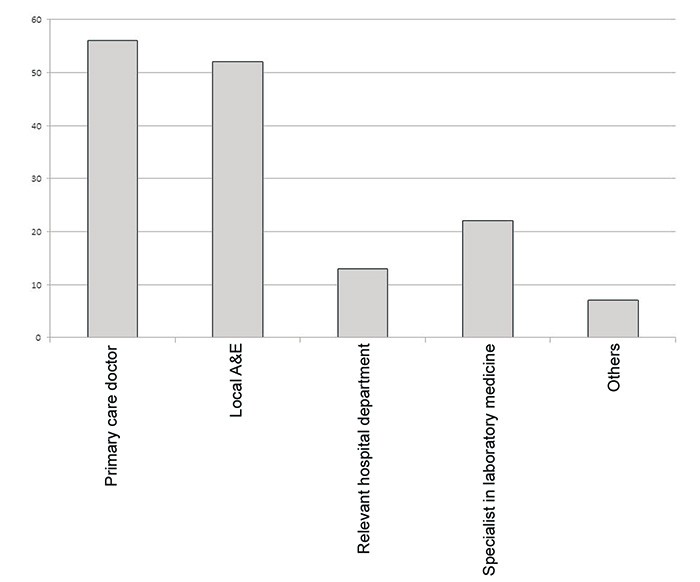
Figure 2  Percentage of GPs who proposed various authorities the laboratory should contact when they discover abnormal laboratory results. Some participants suggested several options.

International literature

The critical limits used internationally are shown in Table 4. It is clear that practice varies substantially, also internationally, with respect to the analytes and concentrations thereof for which notification is issued.

Significance of the critical limits for patient outcomes

For many analytes (e.g. troponins, CRP, D-dimer) there is no definitive concentration that constitutes a significant acute health risk, and in such cases the clinical picture will be more of a deciding factor than the actual analytical result. In the case of other analyses (e.g. electrolytes) patients may have very abnormal or life-threatening values without there being any clear clinical symptoms. For such analyses there may be documentation for when a concentration is associated with a serious condition requiring treatment.

Sodium

With chronic hyponatraemia, symptoms do not usually occur at serum sodium concentrations of over 120 mmol/l (11 – 13), while if there is a rapid fall (less than 24 hours), nausea and faintness occur already at concentrations of less than 125 – 130 mmol/l. If the sodium concentration in the blood falls further (below 115 – 120 mol/l), life-threatening complications may arise (11, 14 – 17). Serious symptoms of hypernatraemia usually do not occur before the sodium concentration in the plasma/serum exceeds 158 mmol/l. Studies have shown that clinics rapidly react and take action if sodium concentrations of less than 120 or more than 155 mmol/l are found (18).

Potassium

In cases of severe hypokalaemia (defined as potassium < 2.5 mmol/l (19)) patients may experience muscular weakness and muscular cramps, in addition to ECG changes and cardiac arrhythmias (20). However, cardiac arrhythmias are rare in patients without known comorbid heart disease (19). Severe hypokalaemia may result in rhabdomyolysis and paralysis (21). Hyperkalaemia may result in muscular weakness, paralysis, severe cardiac arrhythmias and death. The risk of arrhythmia is higher for potassium values greater than 6.0 mmol/l, but is particularly high when potassium is > 6.5 mmol/l (22). There is evidence that patients with renal failure and chronic hyperkalaemia are less susceptible to fatal arrhythmias than patients who develop acute hyperkalaemia (23).

Phosphate

Phosphate deficiency can cause symptoms stemming from the central nervous system, musculature and heart (24). Serious symptoms do not usually develop before the serum phosphate concentration is less than 0.3 mmol/l (25, 26).

Calcium

There is no clear correlation between calcium concentration and symptoms. The degree of seriousness is determined primarily by how rapidly the hypo- or hypercalcaemia develops. (27). Tetany seldom occurs before total calcium falls below 1.9 mmol/l (28) and in rare cases low total calcium may result in serious arrhythmias (28). Chronic moderate hypercalcaemia with calcium values of 3.0 – 3.5 mmol/l may be tolerated relatively well, while the patient may become serious ill, possibly with clouded consciousness, if the hypercalcaemia develops rapidly. Patients with total calcium of over 3.5 mmol/l must be hospitalised immediately and treated, irrespective of what symptoms they might have (29). In rare cases, severe hypercalcaemia may increase the risk of both supraventricular and ventricular cardiac arrhythmias (30).

Magnesium

Severe hypomagnesaemia is defined as magnesium of less than 0.5 mmol/l (31) and is associated with ventricular arrhythmias, particularly in myocardial infarction patients (32). In contrast to hypomagnesaemia, hypermagnesaemia is rare (33). Typical symptoms are neuromuscular (34 – 38), cardiovascular (34, 36, 38) and metabolic (34, 39, 40). The first, mild symptoms of hypermagnesaemia can be observed with magnesium concentrations in the plasma/serum of over 2.0 mmol/l, while magnesium concentrations of over 3.0 mmol/l may extend the atrioventricular conduction time and concentrations of over 5 mmol/l may cause paralysis and cardiac and respiratory arrest (36, 41).

Glucose

Diabetic ketoacidosis and hyperosmolar, non-ketotic hyperglycaemia may by definition occur at glucose values of 13.9 and 33.3 mmol/l respectively (42). One study shows that the average serum glucose level of adults with diabetic ketoacidosis is 25.7 mmol/l (SD 0.9), while the corresponding value in children is 28.0 mmol/l (SD 1.4) (43).

Leukocytes

It is difficult to find documented risk of infection associated with a low leukocyte concentration in isolation. When about 1100 samples with a neutrophil granulocyte concentration of from 0.4 to 0.6·10⁹/l were tested, the leukocyte concentration varied from 0.5 to 5.5 · 10⁹/l. In 90 % of these samples, the leukocyte concentration was < 3.0·10⁹/l. Thus the leukocyte count can vary very considerably with neutropaenia, so the quantity of neutrophil granulocytes should be studied in this situation. The acute health risk represented by a high leukocyte count alone is associated with the risk of leukostasis, tumour lysis syndrome and disseminated intravascular coagulation (DIC) in connection with malignant blood diseases (44). These conditions are rare with leukocytes < 100· 10⁹/l.

Neutrophil granulocytes

The risk of infection with a low concentration of neutrophil granulocytes in the blood depends largely on what reserves the patient has in the bone marrow. There is little correlation between risk of infection and granulocyte concentration in patients with leukopaenia and otherwise normal bone marrow (45). In cancer patients with therapy-induced bone marrow depression, the risk of infection increases when the granulocyte count falls below 1.5·10⁹/l. At concentrations of < 0.5·10⁹/l the risk of infection increases substantially and isolation is called for (46).

Thrombocytes

There is no evidence of any acute risk of major bleeding in cases of thrombocytopaenia before the thrombocyte concentration is < 15 ·10⁹/l (47, 48). Thrombocytosis (> 500 ·10⁹/l) results in a somewhat higher risk of thromboembolic episodes (49). Values > 1000 ·10⁹/l imply a somewhat increased risk of acquired von Willebrand syndrome and of bleeding (50). Thus there is little acute health risk associated with thrombocytosis.

PT-INR

The risk of bleeding complications increases with rising PT-INR values. Studies have shown that the relative risk (number of incidents divided by the total number exposed compared for two cohorts) of major bleeding events increases by about 1.4 per unit increase in the PT-INR (51). For INR values of over 4.5, the relative risk of bleeding complications thus increases to about six (52). Another study shows that the odds ratio (number of patients with events/number of patients without bleeding events compared for two cohorts) for intracranial haemorrhage first increases when the PT-INR exceeds 4.0, and at a PT-INR of about 5, the odds ratio can be estimated at approximately five (53).

The significance of critical limits for the workload of laboratories and GPs

Table 5 shows how many of the laboratory results from Stavanger University Hospital that would require notification against the background of various proposed limits.

Discussion

The data that have been collected shed light on the issue of «notification of abnormal laboratory results» from many different angles. Both national and international practice have been examined, and at the same time the general practitioners who will receive alerts from the laboratories have been questioned and expenditure of resources calculated. Efforts have also been made to find scientific documentation for when an analytical concentration implies a real acute health risk for the patient. Both laboratories and general practitioners have highly varying perceptions of when a laboratory result is so abnormal that it requires immediate action, and hence alerting of the doctor responsible for patient care. The limits defined in international literature are also at variance. Nor can data from international practice automatically be transposed into Norwegian conditions, as analytical methods and the organisation of the health system may be very different from the situation in Norway.

The rate of response to the questionnaire survey by general practitioners was low, but as expected in the light of past experience (54). The median values of the critical limits used by laboratories are more stringent than those proposed by Norwegian GPs. At the same time, a number of doctors stated that they did not want notification of abnormal results. Of those who wanted notification, many failed to specify limits, or wrote on the questionnaire that they thought it was difficult to propose limits. Those who specify limits may therefore represent a group of more cautious doctors, and this may have influenced the limits they proposed. The GPs were generally in favour of being contacted in cases of abnormal results, and regarded it as the responsibility of the primary health service to monitor patients further.

The survey shows clearly that there is great variation in the number of analytes and the concentrations at which the laboratories choose to notify the ordering doctor. Much of the variation can be explained by the fact that it is difficult to find a scientific basis for when analytical results are so abnormal that an alert must be issued, and that many laboratories therefore choose to issue notification of many results, following the precautionary principle. Another reason may be that the choice of limits strongly influences the workload of the laboratory. Locally available resources, or local priorities with respect to customer relations may therefore result in varying practice. Notification of slightly pathological results may easily cause irritation, however, especially in doctors who are contacted during their leisure time.

The study shows that the practice is variable, and that it is likely that both too many and too few alerts are issued in connection with laboratory results from some laboratories. The recommendation of the working group must be taken as guidance, and local adaptations will often be necessary. At the same time, this recommendation should be able to contribute to a more standardised practice based on medical assessments and prudent use of resources.

Anbefalte artikler