Self-rated health is widely used as a measurement of health in epidemiological and social science research (1, 2). This measurement is based on an assumption that people themselves are capable of assessing their own mental and physical health condition, and it is particularly widespread in international population studies that investigate socioeconomic differences in health. Results from studies in which self-rated health is used have proved to be comparable with studies of mortality (1 – 6). One main finding is that differences in health between the various socioeconomic groups are larger in Norway than in several other European countries (7 – 15). This has led the Norwegian government to develop a national strategy to iron out social health inequalities (16).
Health inequalities form a general pattern in which most health problems occur more frequently the lower people are in the socioeconomic hierarchy. An example of this may be taken from the 1980 population census, which showed that a male chef had a life expectancy of 71 years, whereas a lecturer’s life expectancy was 81 years (17).
When such results are present, it is reasonable to wonder to what degree self-rated health can be used as a measurement on a par with disease prevalences, incidence rates, infant mortality and mortality, which are not based on a subjective assessment. The main question is therefore whether self-rated health reflects more objective health variables, such as mortality, in different socioeconomic strata. The answer will depend on whether the respondents consider the same criteria when asked to report on their health. If the chef and the lecturer do not base their self-rated health on the same criteria, the differences in more objective health measures such as mortality will be over- or underestimated in studies that use this health measurement. It has previously been demonstrated that persons from higher socioeconomic classes use objective criteria such as lifestyle or previous illness to a greater extent, and that we will thereby see a greater correlation between clinically relevant information and self-rated health among those with the highest status (18). It has also been assumed that persons from higher socioeconomic classes are more able to understand the effect of chronic disease on mortality (18).
It has previously been shown that self-rated health is an equally good predictor of mortality for the different educational groups in Norway (19). Thus, the differences in self-rated health were not caused by the lower educated «complaining» more about their situation.
Will data show the same if we use occupational class and income instead of education? This may be studied more closely by examining the degree to which self-rated health is a predictor of mortality between socioeconomic groups after we have adjusted for different types of health problems in the groups. It is important to adjust for as many health-related factors as possible, to ensure a fair comparison between the groups.
The purpose of the study was therefore to investigate whether self-rated health is an equally good predictor of mortality for different occupational classes and income groups in Norway, using data from the Nord-Trøndelag Health Study (HUNT).
Material and method
We used data from the HUNT Study in 1984 – 86 (HUNT1), in which the entire adult population aged 20 years and above who were resident in the county were invited to participate (20). Of the 86 404 who were invited, 77 212 participated (89.4 %). Our study included all adults aged 25 years and above. The lower age limit was set to ensure that the socioeconomic position of the participants was well established. Those on a retirement pension (2 218 persons) were excluded from the analyses to simplify the interpretation of the results. After we had also excluded those who had not answered all the questions from the analysis, we were left with a final sample of 42 080. As the endpoint for follow-up (death), data from Statistics Norway’s registry of deaths was used, with 2005 as the last year of registered deaths.
Self-rated health was measured using a four-point scale (1 = very good, 2 = good, 3 = fair, 4 = poor). In the analysis, the variable was divided into the categories good (value 1 – 2) and poor (value 3 – 4).
To enable comparisons with other studies, the original classification of occupational status in HUNT1 was reclassified to approximate the classification of the Erikson-Goldthorpe-Portocarero class scheme (EGP) (21). The classes were further recoded so that the higher-grade class constituted EGP I and II (reference category), the medium-grade class EPG III and IV, and the lower-grade class EGP V, VI and VII. Occupational status was given based on existing or most recent occupation. Where possible, missing information was supplemented by data on occupational status from the 1980 national census.
Income was retrieved from the Income Register as individual income. This was measured in the study using an average income in 1984 and 1985 before the participants were classified into income quartiles.
In the study, we investigate whether self-rated health is an equally good predictor of mortality between socioeconomic groups after adjusting the models for health-related behaviour, serious diseases and functional impairment. The variables included the four serious diseases surveyed in HUNT 1 (diabetes, angina, myocardial infarction and stroke). Chronic disease with functional impairment included reduced mobility, reduced vision, reduced hearing, and loss of function as a result of physical illness and mental illness. Finally, health behaviour (smoking, alcohol consumption and exercise), age and civil status were also included. All the variables are self-reported, and Table 1 provides an overview of the variables included in the study.
|
Table 1 Sample characteristics and deaths during the follow-up period of the Nord-Trøndelag Health Study 1984 – 86 (HUNT1)
|
|
|
Distribution of the sample. N (% of the total sample)
|
|
Died during the follow-up period. N (% of the relevant group)
|
|
Self-rated health
|
|
|
|
|
|
|
Very good
|
7 334
|
(17.4)
|
|
544
|
(7.4)
|
|
Good
|
27 449
|
(65.2)
|
|
3 759
|
(13.7)
|
|
Fair
|
7 023
|
(16.7)
|
|
1 792
|
(25.5)
|
|
Poor
|
274
|
(0.7)
|
|
102
|
(37.2)
|
|
Good/Poor health (dichotomy)
|
|
|
|
|
|
|
Good health
|
34 783
|
(82.7)
|
|
4 303
|
(12.4)
|
|
Poor health
|
7 297
|
(17.3)
|
|
1 894
|
(26.0)
|
|
Income quartiles
|
|
|
|
|
|
|
Income quartile 4 (highest)
|
9 469
|
(22.5)
|
|
1 220
|
(12.9)
|
|
Income quartile 3
|
9 221
|
(21.9)
|
|
1 251
|
(13.6)
|
|
Income quartile 2
|
9 380
|
(22.3)
|
|
1 066
|
(11.4)
|
|
Income quartile 1 (lowest)
|
9 896
|
(23.5)
|
|
1 409
|
(14.2)
|
|
No income
|
4 107
|
(9.8)
|
|
1 249
|
(30.4)
|
|
Occupational class
|
|
|
|
|
|
|
Higher grade
|
8 459
|
(21.6)
|
|
865
|
(10.2)
|
|
Medium grade
|
17 279
|
(44.1)
|
|
2 434
|
(14.1)
|
|
Lower grade
|
11 317
|
(28.9)
|
|
1 726
|
(15.3)
|
|
Unemployed
|
2 123
|
(5.4)
|
|
502
|
(23.6)
|
|
Gender
|
|
|
|
|
|
|
Male
|
20 331
|
(51.9)
|
|
3 508
|
(17.3)
|
|
Female
|
21 749
|
(55.5)
|
|
2 689
|
(12.4)
|
|
Age (grouped)
|
|
|
|
|
|
|
25 – 44
|
23 829
|
(60.8)
|
|
855
|
(3.6)
|
|
45 – 64
|
15 997
|
(40.8)
|
|
3 848
|
(24.1)
|
|
65 – 101
|
2 254
|
(5.8)
|
|
1 494
|
(66.3)
|
Statistics
The Cox Proportional Hazards Model was used in the analyses. A variable was formed with dummy categories based on combinations of self-rated health and occupational class as well as self-rated health and income to reveal differences in the correlation between self-rated health and mortality. All the analyses were performed in STATA 11 IC.
Results
Table 1 presents descriptive statistics for the HUNT1 sample included in the study. Of the sample included in the analysis, 73 % considered their health to be very good or good. During the follow-up period, 2 689 (12.3 %) of the female sample died and 3 508 (17.3 %) of the male sample. If we compare the categories for self-rated health, the results indicate a clear correlation between self-rated health and mortality. Among those who were categorised as having good health, 12.4 % died compared to 26.0 % in the poor health category.
Figure 1 shows the hazard ratios for each combination of occupational class and self-rated health, as well as for each combination of income group and self-rated health, adjusted for age and health-related variables associated with serious disease, functional impairment and health behaviour.
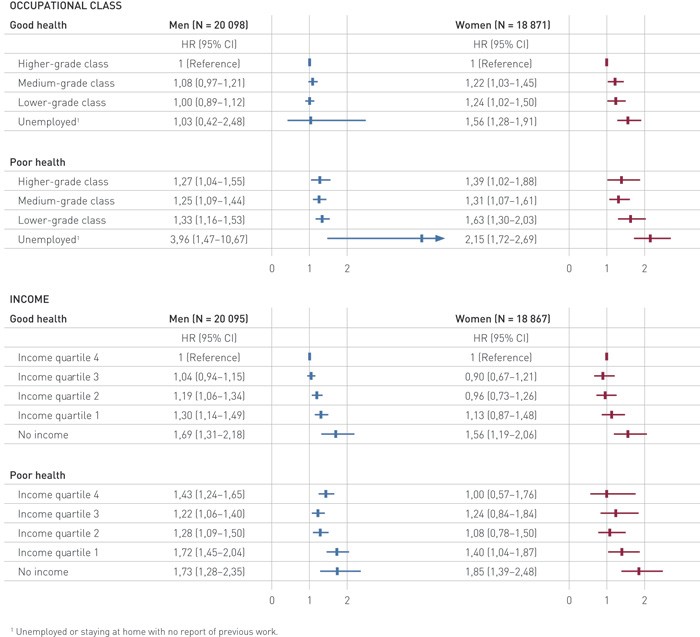
Figure 1 Adjusted hazard ratios (HR) for mortality by self-rated health, occupational class and income (95 % CI). All the models are adjusted for diabetes, angina, myocardial infarction, stroke, reduced mobility, reduced vision, reduced hearing, loss of function as a result of physical illness or mental illness, smoking, alcohol consumption and exercise, as well as age and civil status
Among men, the hazard ratios between the occupational classes that reported good health were 1.08 (0.97 – 1.21) for the medium-grade classes and 1.00 (0.89 – 1.12) for the lowest occupational classes compared to the highest classes. For women who reported good health, the hazard ratios were somewhat higher, but of the same size relative to each other: 1.22 (1.03 – 1.45) for the medium-grade occupational classes and 1.24 (1.02 – 1.50) for the lowest occupational classes. Among those who reported poor health, the hazard ratios were somewhat higher, and particularly among women in the lowest class: 1.63 (1.30 – 2.03).
For income, the pattern was the same as for the occupational classes. The top three income quartiles had relatively similar hazard ratios for both men and women, but in the lowest quartile this was slightly higher among men with poor health: 1.72 (1.45 – 2.04).
By far the highest hazard ratios were observed for those who were unemployed or had not registered their income. We found the highest ratios among unemployed men who reported poor health (3.96 (1.47 – 10.67)) and among women with poor health (2.15 (1.72 – 2.69)). Those who had not registered an income also stood out as having higher mortality. Among men the hazard ratios were 1.69 (1.31 – 2.18) for those with good health and 1.73 (1.28 – 2.35) for those with poor health. For women the same figures were 1.56 (1.19 – 2.06) and 1.85 (1.39 – 2.48), respectively.
Discussion
The main finding from the study is that the correlation between self-rated heath and mortality was equally strong in most occupational classes and income quartiles, among both men and women, but the results also indicate some important exceptions that are also to be regarded as main findings. We found that mortality among the unemployed and economically inactive is higher than for the other socioeconomic groups with corresponding self-rated health. This may indicate that in studies in which self-rated health in the unemployed/economically inactive is compared with the occupationally/economically active, the actual health inequalities are underestimated, and this should be given prominence in the conclusions from these studies. A possible interpretation of this may be that mortality in these groups is associated with more than merely poor health, such as accidents.
Data from HUNT is presumed to provide a good representation of the country as a whole, since socioeconomic inequalities in mortality in the region correspond to the figures for the rest of the country (22). We also know that trends in both cause-specific mortality and the granting of a disability pension in Nord-Trøndelag County follow national trends (Statistics Norway) (23). It is therefore unlikely that the results can be attributed to characteristics of the sample. The fact that 90 % of a total population were followed over a long period is also a strength of the study, and something which places HUNT in a unique position among population studies.
It may be that we have not adjusted our models with a sufficient number of chronic diseases (such as depression) or lifestyle factors, which can possibly explain some of the «residual effect» among economically inactive persons. We can also take into account that it is 30 years since the study was conducted. It is difficult to assess whether the correlation between the concept of health and occupation/income is the same today as it was then, which may have a bearing on the transferability of the study. However, this limitation affects all studies with a long follow-up time, and we can see no good arguments to suggest that these factors may have affected the results to any great extent.
Our findings correspond to European studies, which have investigated the extent to which social class (2, 24), income (25) and education (19, 25 – 26) moderate the effect of self-rated health on mortality. Our study joins the series of those that conclude that there is no risk of over- or underestimating actual health inequalities by using self-rated health as a health measurement. Nevertheless, other studies have drawn different conclusions. In a French study, the authors observed that the predictive power of self-rated health was weaker in higher socioeconomic groups than in the lower groups. They therefore concluded that using self-rated health entails a danger of underestimating health inequalities as a result of income and occupational status (27). Correspondingly, a study of elderly Spaniards found a moderating effect of education on the relationship between self-rated health and mortality among men (28). However, here the predictive ability of self-rated health was strongest among those with high education. This effect was not observed among women. The fact that the literature in this field is inconsistent and that the results from a number of other studies indicate a moderating effect for socioeconomic factors on the correlation between self-rated health and mortality means, however, that the correlation should be studied more closely in several different contexts. It has been argued that future studies should also include mental illness, because this correlates strongly with self-rated health and may contribute to making the correlation with mortality unclear (26).
Our study shows that subjective health is a predictor of mortality irrespective of socioeconomic status among economically active persons in Norway. Although among males, ministers of the church, university teachers, lecturers and doctors have a life expectancy that is ten years longer than that of chefs, farm workers and sailors, it appears that they all consider the same criteria when they are asked to report on their own health (17). Among women we can draw the same parallels between physiotherapists, lecturers and teachers, all of whom have a life expectancy that is five years longer than for chefs, waitresses and metallurgy workers. To put it simply, none of the groups complain more about their health than other groups (17). Of course, it must be mentioned here that experiencing poor health may be as unpleasant for the individual as having poor health. This is illustrated by one of the most widely used definitions of health from the World Health Organization: «a state of complete physical, mental and social wellbeing, and not merely the absence of disease or infirmity» (29). Nevertheless, one reason why the predictive ability of self-rated health for mortality is so similar between socioeconomic groups might be that socioeconomic factors tell us little about actual health knowledge and health experience in Norway, because access to higher education and health services is universal.
Self-rated health is, of course, an intuitive and simplistic definition of health, but its imprecise quality may also be viewed as a strength. When people are asked to assess their health, more dimensions are included in their assessment than it is normally possible for a survey instrument or clinical examination to capture (30). Thus there is no gold standard for what actually constitutes good health, and self-experienced health and mortality also reflect different aspects of health. The fact that these largely conform to socioeconomic strata, as we have found here, is an important observation because it strengthens the credibility of findings from previous and upcoming studies in which self-report surveys are used to measure differences as well as to identify the mechanisms that create them.
Conclusion
This study has demonstrated that the predictive ability of self-rated health for mortality is of the same order of magnitude in different income groups and occupational classes. There is therefore little reason to believe that the use of self-rated health as a measurement of health over- or underestimates actual socioeconomic health differences among economically active persons. This indicates that the differences in self-rated health between different socioeconomic groups in Norway, which have been found in previous national and European comparative studies, are a reality and represent a significant national challenge. We can also conclude that studies which compare self-rated health among the unemployed or economically inactive with economically active persons in all likelihood underestimate the actual health differences. The fact that the inequalities observed between these groups are even greater than assumed should increase the relevance of measures directed at equalising socioeconomic health differences.
