Long-term sickness absence and work incapacity in young adulthood is a problem for the individual affected, and entails poorer future prospects with a view to health, socioeconomic position and labour force participation (1, 2). Sickness absence and work incapacity among young adults also represent a challenge for public health, the social economy and the labour market.
There is a paucity of knowledge about the association between adolescent health and work incapacity or receipt of sickness benefit at a young age. Among young people who receive disability pension and medical and vocational rehabilitation benefits (3, 4), we know that there are many with pervasive chronic conditions and psychiatric illnesses.
We have followed the adolescents who took part in the Nord-Trøndelag Health Study in 1995 – 97 (Young-HUNT1) into young adulthood and studied school dropout and labour market exclusion using links to national registry data. Our previously published studies have contributed to new knowledge about the importance of parental health and other familial factors, and the strong association between upper and lower secondary school dropout and social insurance benefits (5 – 11). Some of these studies also include the association between certain aspects of health in adolescence and later receipt of long-term social insurance benefits in young adulthood. In one study we found, for example, that adolescents with poor self-reported health more frequently received long-term social insurance benefits at the age of 24 – 28 years than adolescents who reported good health (8). In another study we found that the adolescents’ own level of symptoms of anxiety and depression and their parents’ level of these symptoms were associated with the adolescents’ subsequent receipt of long-term health-related benefits at the age of 20 – 29 years (11).
The aim of this study is to investigate how different aspects of adolescent health are related to later receipt of long-term social insurance benefits in the form of sickness benefit, medical/vocational rehabilitation benefit and disability pension. We consider both self-reported health and symptoms of anxiety and depression to be important dimensions in providing an overall picture of adolescent health, and have therefore chosen to include these variables even though they are also included in other studies. Moreover, in the present study both the sample and follow-up time are somewhat different from those in the above-mentioned studies. The results for all health-related benefits are presented collectively, whereas supplementary analyses with each of the specific benefits are available in the online version. In a previous publication we have included descriptive statistics on health and social factors in relation to the different social insurance benefits (5).
Material and method
Participants
The Nord-Trøndelag Health Study (HUNT) is a major health study encompassing the population of Nord-Trøndelag county (12). From 1995 – 97, all lower and upper secondary school students in the county were invited to participate in the Young-HUNT1 study (12). A total of 8949 adolescents completed the questionnaire (90 % of those invited) and 8408 (85 % of those invited) were examined in school hours by a nurse, including measurements of their weight and height. Using their personal identification numbers, it was possible to link data on the participants in Young-HUNT to various national registries administered by Statistics Norway. Parents and siblings (those with the same biological mother) were identified in the Family Registry, and educational data were retrieved from the National Education Database (NUDB). Information on demography and circumstances regarding social insurance for the period 1998 – 2008 were retrieved from the historical event database FD-Trygd. More detailed information on data collections is available at www.ssb.no/mikrodata. We excluded 47 persons from the study due to receipt of disability pension before the age of 20 years (n = 18), death before the age of 20 years (n = 10), migration before the age of 20 years (n = 11), born after 1983 (n = 4) or inconsistency between age and educational level (n = 4). The study has been approved by the Regional Ethics Committee (REC Central, reference 2010/1527 – 5), including the link to the various registries. Written consent was obtained from all participants, and parental consent for adolescents aged less than 16 years.
Measurements of adolescent health
Information about adolescents’ self-reported health was retrieved from the questionnaire in Young-HUNT1. We selected health variables that we considered relevant in relation to the research question, that were as specific as possible, that could elucidate objective as well as subjective dimensions of health and disease, and that primarily could be a possible (contributory) cause of work incapacity. We therefore chose to limit information on health behaviour to BMI and smoking, which are known to be associated with work incapacity in adults (but which are difficult to regard as the cause in young adults). The health variables were used to define eight different «health problems» based on previously used and more established definitions where these existed, and otherwise using categories that are described below and in more detail elsewhere (5, 6).
When the adolescent reported to have been given a diagnosis of asthma, diabetes, migraine or epilepsy by a medical doctor or to have had another illness lasting more than three months (yes/no question for each illness), we defined this as somatic illness and the variable was divided into «no somatic illness» and «one or more somatic illnesses».
Somatic symptoms were measured using eight self-reported symptoms (headache, neck and shoulder pain, joint and muscle pain, stomach pain, nausea, constipation, diarrhoea/gastric illness, palpitations). The presence of a given symptom was defined as having «often» or «occasionally» been troublesome over the previous 12 months, in contrast to «seldom» or «never». The number of symptoms was also added up (scale 0 – 8) and then divided into «one or no symptoms» (the lowest two tertiles) and «two or more symptoms» (upper tertile).
Symptoms of anxiety and depression were measured using SCL-5, which is a validated, abbreviated version of the Hopkins Symptom Checklist consisting of five questions with four response alternatives and scoring on a scale of 1 – 4 (13). The adolescents were asked to indicate the extent to which in the previous 14 days they had been troubled by feelings of fear/anxiety, tension/restlessness, despondency/sadness, hopelessness when thinking of the future, and excessive worry (from 1 «not troubled» to 4 «very troubled»). We calculated an average SCL-5 score, and according to validated recommendations (13) a score of more than 2 was defined as «high level» of symptoms of anxiety and depression, while a score of 2 or below was defined as «low level».
Sleep disturbance was measured using the question «In the past month, have you found it difficult to fall asleep?» and the four response alternatives were combined to «almost every night/often» versus «occasionally/never».
Poor concentration was defined as «often» or «very often» finding it difficult to concentrate in class (now or previously) – in contrast to «never» or «occasionally».
Self-reported health was measured using the question «How is your health at the moment?», and the four response alternatives were combined to «good/very good» versus «poor/fair» (14).
Height and weight were measured by nurses according to a standard protocol. BMI was calculated and classified as overweight (corresponding to BMI 25 – 30 in adults) and obese (corresponding to BMI over 30 in adults) in relation to age, as recommended by The International Obesity Task Force (15).
Smokers were identified by the response «Yes» to the question «Have you tried smoking?» combined with the responses «Yes, I smoke daily» or «Yes, I smoke occasionally but not daily» to the question «Do you smoke?» Non-smokers were defined as «never smoked» or «have quit smoking» (16).
Number of health problems (scale 0 – 8) was added up for those who had responded to all the above-mentioned health variables as a measurement of the accumulated health burden.
Long-term health-related benefits
Long-term sickness and disability benefits (long-term benefits) were measured as sickness benefit for at least 180 days in a calendar year, medical/vocational rehabilitation benefit, or temporary and long-term disability pension. This information was retrieved from FD-Trygd in the period from 1998 (the year after the Young-HUNT1 study was completed) up to and including 2008, which was the last complete year with available data for all the above-mentioned social insurance benefits for the date that the data were submitted (2010 – 11). Long-term benefit was defined as a minimum of one instance of long-term benefit in a calendar year in the period in which each participant was aged 20 – 29 years.
Confounding variables
We used causal diagrams to identify possible confounding factors (17). Information on sex, age, school level and family composition was retrieved from the questionnaire used in Young-HUNT1, and information on mother’s education was retrieved from the National Education Database (NUDB) and recorded when the participant was 16 years old. Family composition was defined as «traditional family» (living with biological father and mother) or otherwise. Mother’s level of education was divided into three categories: primary and lower secondary school, upper secondary school and university college/university.
Many confounding factors may be difficult to define and measure, and this applies in particular to an adolescent’s home environment and family which may be assumed to be a common cause (confounding factor) of both health problems and work incapacity. A comparison of siblings will automatically adjust for all the factors that siblings share, such as parents’ illness, parenting style, place of residence and so on (18). Siblings were defined as those with the same biological mother (same reference number for mother).
Statistics
Main analyses. The relationship between each of the eight selected health variables in Young-HUNT1 and long-term benefits at the age of 20 – 29 years was examined using logistic regression analyses adjusted for sex, age, follow-up time (model 1) and in addition mother’s level of education and family composition (model 2). In each analysis we included all those with complete data, so that the total number varied somewhat between the analyses. The association between number of health problems (the accumulated health burden) and later long-term social insurance benefits was studied in a separate analysis stratified by sex and adjusted for age, follow-up time, mother’s education and family composition.
Supplementary analyses. We also performed analyses with some of the health variables more precisely categorised (number of illnesses, type of somatic condition, number of symptoms, sleep disturbance, poor concentration, self-reported health) and as continuous variables (SCL-5, BMI, number of health problems/accumulated health burden) adjusted for age, sex, follow-up time, mother’s education and family composition. In addition, we examined the association between the health variables and health-related social insurance benefits classified as the various types of long-term benefits (sickness benefit, medical/vocational rehabilitation benefit and disability pension). Using multinomial logistic regression, each of the three groups of benefit recipients (each individual registered with only one type of benefit, ranked disability pension > medical/vocational rehabilitation benefit > sickness benefit) was compared with the group that did not receive benefits, in analyses adjusted for age, sex, follow-up time, mother’s education and family composition.
Interaction analyses. In the form of a test for statistical interaction in the analyses, we examined whether the association between the health variables and subsequent long-term social insurance benefits was different for boys and girls, for those in lower secondary school in comparison to those in upper secondary school, and for those with mothers of low education in comparison to those with highly educated mothers. Sex differences were also examined using sex-stratified analyses (see appendix).
Sibling analyses. Using conditional logistic regression analyses, we studied the association between the adolescents’ health and long-term social insurance benefits within sibling groups. Information from siblings with different outcomes (here different social insurance status) is used for these analyses and the degree of exposure (adolescent health) compared within the sibling groups. The purpose of these sibling analyses is to control for all observed and non-observed family factors which siblings share, so that confounding factors at family level are adjusted for. These analyses were also adjusted for sex, age, follow-up time and family composition.
Outcome measures. All analyses were performed in STATA 13.1 (StataCorp LP). The results from the regression analyses are mainly presented as risk difference. Risk difference (RD) expresses differences in absolute risk (percentage points) between (two) groups and is estimated from logistic regression analyses with all the covariates set to mean. The results from the sibling analyses and the multinomial regression analyses are presented as odds ratio and relative risk (relative outcome measures). All the estimates are presented with 95 % confidence intervals (CI).
Results
Of the 8902 adolescents, 1299 (15 %) received long-term benefits at the age of 20 – 29 years, whereof 752 were women and 547 were men. Many received several types of benefits in the period, but if we only allow one registered form of benefit per person and rank the benefits as disability pension > medical and vocational rehabilitation benefit > sickness benefits, the receipt of social insurance benefits at the age of 20 – 29 years is distributed as follows: 152 (2 %) persons with disability pension, 650 (7 %) persons with medical and/or vocational rehabilitation benefit, and 497 (6 %) persons on long-term sickness benefits (corresponding data was previously presented for a slightly different sample (5)). Of the 3254 in the cohort who were registered with one or more siblings, 445 (14 %) received long-term benefits, and 725 individuals (distributed among 345 sibling groups) had at least one sibling with different status with regard to receipt of long-term benefits (different outcome). The overview of characteristics of the cohort and the extent of long-term social insurance benefits given in Table 1 and Table 2, partly overlap with descriptive statistics in our previous publications (several of which use other samples) (5 – 11, 19). Average follow-up time was 8.4 years (SD 1.4).
|
Table 1 Overview of health and family factors among adolescents in the Young-HUNT1 cohort and the extent of receipt of long-term benefits such as sickness benefit, medical/vocational rehabilitation benefit and disability pension at the age of 20 – 29 years. Number ( %) if not otherwise indicated
|
|
Total
|
|
Receipt of benefit
|
|
Age (years), average (SD)
|
16.0
|
(1.94)
|
|
16.0
|
(1.89)
|
|
Sex
|
|
|
|
|
|
|
Boys
|
4 485
|
(50)
|
|
547
|
(12)
|
|
Girls
|
4 417
|
(50)
|
|
752
|
(17)
|
|
Individual health factors
|
|
|
|
|
|
|
Somatic illness
|
|
|
|
|
|
|
None
|
7 077
|
(80)
|
|
938
|
(13)
|
|
One or more
|
1 825
|
(20)
|
|
361
|
(20)
|
|
Missing
|
|
(0)
|
|
|
(0)
|
|
Somatic symptoms
|
|
|
|
|
|
|
None or one
|
5 475
|
(62)
|
|
655
|
(12)
|
|
Two or more
|
3 110
|
(35)
|
|
561
|
(18)
|
|
Missing
|
317
|
(4)
|
|
83
|
(26)
|
|
Symptoms of anxiety and depression
|
|
|
|
|
|
|
Low level
|
7 852
|
(88)
|
|
1 073
|
(14)
|
|
High level
|
880
|
(10)
|
|
180
|
(20)
|
|
Missing
|
170
|
(2)
|
|
46
|
(27)
|
|
Average (1 – 4) (SD)
|
1.46
|
(0.50)
|
|
1.55
|
(0.56)
|
|
Sleep disturbances
|
|
|
|
|
|
|
Sometimes/never
|
7 878
|
(89)
|
|
1 096
|
(14)
|
|
Frequently/almost nightly
|
891
|
(10)
|
|
168
|
(19)
|
|
Missing
|
133
|
(1)
|
|
35
|
(26)
|
|
Poor concentration
|
|
|
|
|
|
|
Never/occasionally
|
6 608
|
(74)
|
|
875
|
(13)
|
|
Frequently/very frequently
|
2 113
|
(24)
|
|
379
|
(18)
|
|
Missing
|
181
|
(2)
|
|
45
|
(25)
|
|
Self-reported health
|
|
|
|
|
|
|
Very good/good
|
7 798
|
(88)
|
|
1 053
|
(14)
|
|
Fair/poor
|
955
|
(11)
|
|
224
|
(23)
|
|
Missing
|
149
|
(2)
|
|
22
|
(15)
|
|
BMI
|
|
|
|
|
|
|
Normal weight
|
6 911
|
(78)
|
|
918
|
(13)
|
|
Overweight
|
1 188
|
(13)
|
|
218
|
(18)
|
|
Obese
|
251
|
(3)
|
|
57
|
(23)
|
|
Missing
|
552
|
(6)
|
|
106
|
(19)
|
|
Average (SD)
|
21.35
|
(3.28)
|
|
21.86
|
(3.73)
|
|
Smoking
|
|
|
|
|
|
|
Never
|
6 807
|
(77)
|
|
894
|
(13)
|
|
Daily/occasionally
|
1 886
|
(21)
|
|
369
|
(20)
|
|
Missing
|
209
|
(2)
|
|
36
|
(17)
|
|
Number of health problems (accumulated health burden)
|
|
|
|
|
|
None
|
2 269
|
(25)
|
|
209
|
(9)
|
|
One health problem
|
2 330
|
(26)
|
|
277
|
(12)
|
|
Two health problems
|
1 479
|
(17)
|
|
215
|
(15)
|
|
Three health problems
|
876
|
(10)
|
|
165
|
(19)
|
|
4 – 8 health problems
|
760
|
(9)
|
|
185
|
(24)
|
|
Missing
|
1 188
|
(13)
|
|
248
|
(21)
|
|
Family factors
|
|
|
|
|
|
|
Mother’s level of education
|
|
|
|
|
|
|
Primary and lower secondary school
|
2 416
|
(27)
|
|
481
|
(20)
|
|
Upper secondary school
|
4 420
|
(50)
|
|
607
|
(14)
|
|
University/university college
|
2 026
|
(23)
|
|
208
|
(10)
|
|
Missing
|
40
|
(0)
|
|
3
|
(8)
|
|
Family composition
|
|
|
|
|
|
|
Non-traditional family
|
2 340
|
(26)
|
|
490
|
(21)
|
|
Traditional family
|
6 434
|
(73)
|
|
785
|
(12)
|
|
Missing
|
128
|
(1)
|
|
24
|
(19)
|
|
Observations
|
8 902
|
|
|
1 299
|
(15)
|
|
Table 2 Sex-stratified overview of health and family factors among adolescents in the Young-HUNT1 cohort and the extent of receipt of long-term benefits such as sickness benefit, medical/vocational rehabilitation benefits and disability pension at the age of 20 – 29 years. Number (%) if not otherwise indicated
|
|
Girls
|
|
Boys
|
|
Total
|
|
Receipt of benefit
|
|
Total
|
|
Receipt of benefit
|
|
Age (years), average (SD)
|
16.0
|
(1.9)
|
|
16.0
|
(1.9)
|
|
16.1
|
(1.9)
|
|
16.1
|
(1.9)
|
|
Individual health factors
|
|
|
|
|
|
|
|
|
|
|
|
|
Somatic illness
|
|
|
|
|
|
|
|
|
|
|
|
|
None
|
3 460
|
(78)
|
|
533
|
(15)
|
|
3 617
|
(81)
|
|
404
|
(11)
|
|
One or more
|
957
|
(22)
|
|
219
|
(23)
|
|
868
|
(19)
|
|
142
|
(16)
|
|
Missing
|
|
(0)
|
|
|
|
|
|
|
|
|
|
|
Somatic symptoms
|
|
|
|
|
|
|
|
|
|
|
|
|
None or one
|
2 212
|
(50)
|
|
307
|
(14)
|
|
3 263
|
(73)
|
|
348
|
(11)
|
|
Two or more
|
2 048
|
(46)
|
|
397
|
(19)
|
|
1 062
|
(24)
|
|
164
|
(15)
|
|
Missing
|
157
|
(4)
|
|
48
|
(31)
|
|
160
|
(4)
|
|
35
|
(22)
|
|
Symptoms of anxiety and depression
|
|
|
|
|
|
|
|
|
|
|
|
|
Low level
|
3 719
|
(84)
|
|
598
|
(16)
|
|
4 133
|
(92)
|
|
475
|
(11)
|
|
High level
|
634
|
(14)
|
|
140
|
(22)
|
|
246
|
(5)
|
|
70
|
(16)
|
|
Missing
|
64
|
(1)
|
|
14
|
(22)
|
|
106
|
(2)
|
|
32
|
(30)
|
|
Average (1 – 4) (SD)
|
1.6
|
(0.5)
|
|
1.6
|
(0.6)
|
|
1.3
|
(0.4)
|
|
1.4
|
(0.5)
|
|
Sleep disturbance
|
|
|
|
|
|
|
|
|
|
|
|
|
Occasionally/never
|
3 837
|
(87)
|
|
632
|
(16)
|
|
4 041
|
(90)
|
|
464
|
(11)
|
|
Frequently/almost nightly
|
525
|
(12)
|
|
106
|
(20)
|
|
366
|
(8)
|
|
62
|
(17)
|
|
Missing
|
55
|
(1)
|
|
14
|
(25)
|
|
78
|
(2)
|
|
21
|
(27)
|
|
Poor concentration
|
|
|
|
|
|
|
|
|
|
|
|
|
Never/occasionally
|
3 275
|
(74)
|
|
525
|
(16)
|
|
3 333
|
(74)
|
|
350
|
(11)
|
|
Frequently/very frequently
|
1 075
|
(24)
|
|
212
|
(20)
|
|
1 038
|
(23)
|
|
167
|
(16)
|
|
Missing
|
67
|
(2)
|
|
15
|
(22)
|
|
114
|
(3)
|
|
30
|
(26)
|
|
Self-reported health
|
|
|
|
|
|
|
|
|
|
|
|
|
Very good/good
|
3 818
|
(86)
|
|
592
|
(16)
|
|
3 980
|
(89)
|
|
461
|
(12)
|
|
Fair/poor
|
525
|
(12)
|
|
149
|
(28)
|
|
430
|
(10)
|
|
75
|
(17)
|
|
Missing
|
74
|
(2)
|
|
11
|
(15)
|
|
75
|
(2)
|
|
11
|
(15)
|
|
BMI
|
|
|
|
|
|
|
|
|
|
|
|
|
Normal weight
|
3 478
|
(79)
|
|
545
|
(16)
|
|
3 433
|
(77)
|
|
373
|
(11)
|
|
Overweight
|
594
|
(13)
|
|
127
|
(21)
|
|
594
|
(13)
|
|
91
|
(15)
|
|
Obese
|
121
|
(3)
|
|
32
|
(26)
|
|
130
|
(3)
|
|
25
|
(19)
|
|
Missing
|
224
|
(5)
|
|
48
|
(21)
|
|
328
|
(7)
|
|
58
|
(18)
|
|
Average (SD)
|
21.5
|
(3.3)
|
|
22.1
|
(3.7)
|
|
21.2
|
(3.3)
|
|
21.6
|
(3.7)
|
|
Smoking
|
|
|
|
|
|
|
|
|
|
|
|
|
Never
|
3 325
|
(75)
|
|
520
|
(16)
|
|
3 482
|
(78)
|
|
374
|
(11)
|
|
Daily/occasionally
|
1 022
|
(23)
|
|
220
|
(22)
|
|
864
|
(19)
|
|
149
|
(17)
|
|
Missing
|
70
|
(2)
|
|
12
|
(17)
|
|
139
|
(3)
|
|
24
|
(17)
|
|
Number of health problems (accumulated health burden)
|
|
|
|
|
|
|
|
|
|
|
|
|
None
|
964
|
(22)
|
|
108
|
(11)
|
|
1 305
|
(29)
|
|
99
|
(8)
|
|
One health problem
|
1 122
|
(25)
|
|
147
|
(13)
|
|
1 208
|
(27)
|
|
130
|
(11)
|
|
Two health problems
|
797
|
(18)
|
|
132
|
(17)
|
|
682
|
(15)
|
|
83
|
(12)
|
|
Three health problems
|
525
|
(12)
|
|
111
|
(21)
|
|
351
|
(8)
|
|
54
|
(15)
|
|
4 – 8 health problems
|
500
|
(11)
|
|
130
|
(26)
|
|
260
|
(6)
|
|
55
|
(21)
|
|
Missing
|
509
|
(12)
|
|
122
|
(24)
|
|
679
|
(15)
|
|
126
|
(19)
|
|
Family factors
|
|
|
|
|
|
|
|
|
|
|
|
|
Mother’s level of education
|
|
|
|
|
|
|
|
|
|
|
|
|
Primary and lower secondary school
|
1 211
|
(27)
|
|
279
|
(23)
|
|
1 205
|
(27)
|
|
202
|
(17)
|
|
Upper secondary school
|
2 186
|
(49)
|
|
355
|
(16)
|
|
2 234
|
(50)
|
|
252
|
(11)
|
|
University/university college
|
1 001
|
(23)
|
|
117
|
(12)
|
|
1 025
|
(23)
|
|
91
|
(9)
|
|
Missing
|
19
|
(0)
|
|
1
|
(5)
|
|
21
|
(0)
|
|
2
|
(10)
|
|
Family composition
|
|
|
|
|
|
|
|
|
|
|
|
|
Non-traditional family
|
1 195
|
(27)
|
|
280
|
(23)
|
|
1 145
|
(26)
|
|
210
|
(18)
|
|
Traditional family
|
3 170
|
(72)
|
|
464
|
(15)
|
|
3 264
|
(73)
|
|
321
|
(10)
|
|
Missing
|
52
|
(1)
|
|
8
|
(15)
|
|
76
|
(2)
|
|
16
|
(21)
|
|
Observations
|
4 417
|
|
|
752
|
(17)
|
|
4 485
|
|
|
547
|
(12)
|
Main analyses
We found statistically significant associations between each of the health problems measured in adolescence and later receipt of long-term social insurance benefits at the age of 20 – 29 years. Table 3 and Table 4 show the estimated increase in risk (risk difference, RD) of long-term social insurance benefits for each of the eight selected health variables in two categories (three for BMI). The risk differences for the various health problems were 4 – 10 percentage points after adjusting for age, sex and follow-up time (Model 1) and were only slightly reduced when further adjusted for mother’s education and family composition in Model 2. Figure 1 shows how the risk of long-term social insurance benefits at the age of 20 – 29 years increased with the total number of reported health problems (accumulated health burden) for boys and girls.
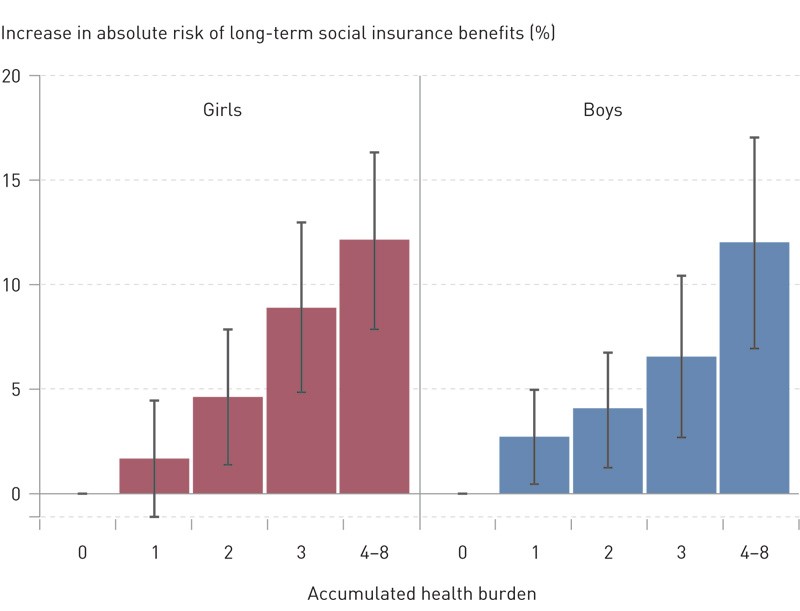
Figure 1 Association between the accumulated health burden in adolescence¹ and risk of long-term benefits at the age of 20 – 29, Young-HUNT1. The bar graphs show the differences in absolute risk (risk differences with 95 % confidence intervals) ² compared to those who had no health problems
¹ Number of health problems: somatic illness (≥ 1), somatic symptoms (≥ 2), symptoms of anxiety and depression, poor self-reported health, poor concentration, sleep disturbances, overweight/obesity and smoking
² From logistic regression analyses adjusted for age, follow-up time, mother’s education and family composition for the 7628 adolescents with no missing information on health
|
Table 3 Risk difference (RD, as percentage points) with 95 % confidence interval (CI) for receiving long-term benefits at the age of 20 – 29 years according to various health factors measured in adolescence (Young-HUNT1). The estimates are based on logistic regression analyses
|
|
Variables¹
|
Model 1² RD (95 % CI)
|
|
Model 2³ RD (95 % CI)
|
|
Somatic illnesses (number, 0 – 5)
|
|
|
|
|
|
|
One or more vs. none
|
6.2
|
(4.3 – 8.2)
|
|
5.4
|
(3.5 – 7.3)
|
|
Somatic symptoms (number, 0 – 8)
|
|
|
|
|
|
|
Two or more vs. none or one
|
5.1
|
(3.5 – 6.8)
|
|
4.3
|
(2.7 – 5.9)
|
|
Symptoms of anxiety and depression (SCL-5 score 1 – 4)
|
|
|
|
|
|
|
High level (score >2) vs. low level (score ≤ 2)
|
4.9
|
(2.2 – 7.6)
|
|
3.8
|
(1.2 – 6.3)
|
|
Sleep disturbance
|
|
|
|
|
|
|
«Frequently/almost nightly» vs. «never/occasionally»
|
4.2
|
(1.6 – 6.9)
|
|
3.7
|
(1.2 – 6.3)
|
|
Poor concentration
|
|
|
|
|
|
|
«Frequently/very frequently» vs. «never/occasionally»
|
4.5
|
(2.6 – 6.3)
|
|
3.4
|
(1.6 – 5.2)
|
|
Self-reported health
|
|
|
|
|
|
|
«Fair/poor» vs. «very good /good»
|
9.8
|
(7.0 – 12.6)
|
|
7.7
|
(5.1 – 10.4)
|
|
BMI
|
|
|
|
|
|
|
Overweight (BMI 25 – 30) vs. normal weight (BMI < 25)
|
5.2
|
(2.9 – 7.6)
|
|
4.1
|
(1.9 – 6.3)
|
|
Obesity (BMI > 30) vs. normal weight (BMI < 25)
|
9.6
|
(4.4 – 14.9)
|
|
8.2
|
(3.2 – 13.2)
|
|
Smoking
|
|
|
|
|
|
|
«Daily/occasionally» vs. «never»
|
6.1
|
(4.1 – 8.1)
|
|
4.5
|
(2.6 – 6.5)
|
|
[i]
|
|
Table 4 Risk differences (RD, as percentage points) with 95 % confidence interval (CI) for receipt of long-term benefits at the age of 20 – 29 years according to various health factors measured in adolescence, for girls and boys (Young-HUNT1). The estimates are based on logistic regression analyses¹
|
|
Girls RD (95 % CI)
|
Boys RD (95 % CI)
|
|
Somatic illnesses (number, 0 – 5)
|
|
|
|
|
|
One or more vs. none
|
6.4
|
(3.5 – 9.2)
|
4.5
|
(2.0 – 7.1)
|
|
Somatic symptoms (number, 0 – 8)
|
|
|
|
|
|
Two or more vs. none or one
|
4.8
|
(2.6 – 7.0)
|
3.9
|
(1.6 – 6.2)
|
|
Symptoms of anxiety and depression (SCL-5 score 1 – 4)
|
|
|
|
|
|
High level (score > 2) vs. low level (score ≤ 2)
|
4.6
|
(1.2 – 7.9)
|
2.9
|
(–1.5 – 7.3)
|
|
Sleep disturbance
|
|
|
|
|
|
«Frequently/almost nightly» vs. «never/occasionally»
|
2.9
|
(–0.6 – 6.5)
|
5.1
|
(1.2 – 9.0)
|
|
Poor concentration
|
|
|
|
|
|
«Frequently/very frequently» vs. «never/occasionally»
|
2.5
|
(–0.1 – 5.2)
|
4.3
|
(1.9 – 6.6)
|
|
Self-reported health
|
|
|
|
|
|
«Fair/poor» vs. «very good /good»
|
10.3
|
(6.4 – 14.2)
|
5.0
|
(1.5 – 8.6)
|
|
BMI
|
|
|
|
|
|
Overweight (BMI 25 – 30) vs. normal weight (BMI < 25)
|
4.3
|
(1.0 – 7.7)
|
4.0
|
(1.0 – 6.9)
|
|
Obesity (BMI > 30) vs. normal weight (BMI < 25)
|
9.1
|
(1.5 – 16.8)
|
7.2
|
(0.8 – 13.6)
|
|
Smoking
|
|
|
|
|
|
«Daily/occasionally» vs. «never»
|
4.3
|
(1.5 – 7.1)
|
4.9
|
(2.2 – 7.5)
|
|
[i]
|
Supplementary analyses
In analyses for which we used a more precise subclassification of the health variables, there was a clear dose-response effect: the greater the symptom load or the higher the reporting of illness, the greater the risk of long-term benefits (Table 5). Results of the analyses of the relationship between health problems and the different types of health-related benefits are presented in Table 6. These analyses showed a statistically significant association between all the health variables and receipt of medical /vocational rehabilitation benefits. The same applied to disability pension, with the exception of somatic symptoms, sleep disturbances and smoking. The associations were somewhat weaker for long-term sickness benefits, but were present for several of the health variables. The exceptions were symptoms of anxiety and depression, sleep disturbances, poor concentration and obesity.
|
Table 5 Risk difference (RD, as percentage points) with 95 % confidence interval (CI) for receipt of long-term benefits at the age of 20 – 29 years according to a subclassification of various health factors measured in adolescence (Young-HUNT1). The estimates are based on logistic regression analyses.
|
|
Variables¹
|
RD (95 % CI)²
|
|
Somatic illnesses (number, 0 – 5)
|
|
|
|
One vs. none
|
4.5
|
(2.6 – 6.5)
|
|
Two or more vs. none
|
14.0
|
(7.4 – 20.7)
|
|
Type of somatic illness
|
|
|
|
Epilepsy vs. none
|
11.3
|
(2.3 – 20.2)
|
|
Diabetes vs. none
|
13.6
|
(0.1 – 27.0)
|
|
Asthma vs. none
|
4.1
|
(0.8 – 7.3)
|
|
Migraine vs. none
|
2.9
|
(–1.2 – 7.0)
|
|
Other chronic illness vs. none
|
6.3
|
(3.1 – 9.5)
|
|
Somatic symptoms (number, 0 – 8)
|
|
|
|
One vs. none
|
2.8
|
(1.0 – 4.6)
|
|
Two vs. none
|
3.3
|
(1.2 – 5.4)
|
|
Three vs. none
|
6.6
|
(3.8 – 9.4)
|
|
Four vs. none
|
7.0
|
(3.3 – 10.8)
|
|
Five or more vs. none
|
10.8
|
(6.5 – 15.1)
|
|
Symptoms of anxiety and depression (continuous, scale 1 – 4)
|
3.0
|
(1.6 – 4.4)
|
|
Sleep disturbance
|
|
|
|
«Occasionally» vs. «never»
|
1.0
|
(–0.6 – 2.5)
|
|
«Frequently» vs. «never»
|
4.0
|
(0.9 – 7.0)
|
|
«Almost nightly» vs. «never»
|
7.1
|
(1.9 – 12.3)
|
|
Poor concentration
|
|
|
|
«Occasionally vs. «never»
|
–4.1
|
(–6.9 – –1.2)
|
|
«Frequently» vs. «never»
|
–1.0
|
(–4.3 – 0.2)
|
|
«Very frequently» vs. «never»
|
3.0
|
(–1.7 – 7.7)
|
|
Self-reported health
|
|
|
|
«Good» vs. «very good»
|
5.1
|
(3.6 – 6.7)
|
|
«Fair» vs. «very good»
|
11.1
|
(8.3 – 14.0)
|
|
«Poor» vs. «very good»
|
17.3
|
(4.8 – 29.9)
|
|
BMI (continuous)
|
0.5
|
(0.3 – 0.7)
|
|
Number of health problems (accumulated health burden) (continuous, scale 0 – 8)
|
2.1
|
(1.7 – 2.6)
|
|
[i]
|
|
Table 6 Relative risk ratio (RRR) with 95 % confidence interval (CI) for receipt of long-term sickness benefit, medical/vocational rehabilitation benefits and disability pension at the age of 20 – 29 years according to various health factors measured in adolescence (Young-HUNT 1). The estimates are based on multinomial logistic regression and adjusted for sex, age, follow-up time, mother’s education and family composition
|
|
Sickness benefit RRR (95 % CI)
|
|
Medical/vocational rehabilitation benefit RRR (95 % CI)
|
|
Disability pension RRR (95 % CI)
|
|
Somatic illnesses (number, 0 – 5)
|
|
|
|
|
|
|
|
|
|
One or more vs. none
|
1.4
|
(1.1 – 1.7)
|
|
1.7
|
(1.4 – 2.0)
|
|
2.2
|
(1.5 – 3.1)
|
|
Somatic symptoms (number, 0 – 8)
|
|
|
|
|
|
|
|
|
|
Two or more vs. none or one
|
1.5
|
(1.3 – 1.8)
|
|
1.6
|
(1.3 – 1.9)
|
|
1.2
|
(0.8 – 1.7)
|
|
Symptoms of anxiety and depression (SCL-5 score, 1 – 4)
|
|
|
|
|
|
|
|
|
|
High level (score >2) vs. low level (score ≤ 2)
|
1.1
|
(0.8 – 1.5)
|
|
1.7
|
(1.4 – 2.2)
|
|
1.6
|
(1.0 – 2.7)
|
|
Sleep disturbance
|
|
|
|
|
|
|
|
|
|
«Frequently/almost nightly» vs. «never/occasionally»
|
1.2
|
(0.6 – 2.0)
|
|
1.6
|
(1.3 – 2.0)
|
|
0.9
|
(0.5 – 1.7)
|
|
Poor concentration
|
|
|
|
|
|
|
|
|
|
«Frequently/very frequently vs. «never/occasionally»
|
1.2
|
(0.9 – 1.4)
|
|
1.5
|
(1.3 – 1.8)
|
|
1.9
|
(1.3 – 2.7)
|
|
Self-reported health
|
|
|
|
|
|
|
|
|
|
«Fair/poor» vs. «very good/good»
|
1.3
|
(1.0 – 1.7)
|
|
2.3
|
(1.9 – 2.8)
|
|
3.1
|
(2.1 – 4.6)
|
|
BMI
|
|
|
|
|
|
|
|
|
|
Overweight (BMI 25 – 30) vs. normal weight (BMI < 25)
|
1.4
|
(1.1 – 1.8)
|
|
1.5
|
(1.2 – 1.8)
|
|
1.9
|
(1.2 – 2.8)
|
|
Obesity (BMI > 30) vs. normal weight (BMI < 25)
|
1.2
|
(0.7 – 2.1)
|
|
2.4
|
(1.7 – 3.5)
|
|
2.5
|
(1.2 – 5.3)
|
|
Smoking
|
|
|
|
|
|
|
|
|
|
«Daily/occasionally» vs. «never»
|
1.3
|
(1.0 – 1.6)
|
|
2.0
|
(1.7 – 2.4)
|
|
1.0
|
(0.7 – 1.6)
|
Interaction analyses
The boys in the cohort had an approximately five percentage points lower risk of receiving long-term benefits at the age of 20 – 29 years than the girls (RD –4.9, 95 % CI –6.3 to –3.4). There were small differences between the sexes in the associations between the health factors and long-term benefits (p-value for statistical interaction between each health variable and sex > 0.05). Results from sex-stratified analyses are presented in Tables 2 and 4. We found no statistical interaction between the health variables and mother’s level of education or school level/age in Young-HUNT 1.
Sibling analyses
Adolescents who reported more health problems overall than their siblings received a greater degree of long-term benefits (OR 1.2, 95 % CI 1.0 – 1.4 per increase of one on a scale of 0 – 8) compared to their siblings. Similarly, adolescents who reported poor health had a statistically significant increased risk of receipt of long-term benefits compared to their siblings who reported good health (OR 2.1, 95 % CI 1.3 – 3.4), and adolescents who smoked had an increased risk compared to their non-smoking siblings (OR 1.7, 95 % CI 1.1 – 2.6) (Table 7).
|
Table 7 Odds ratio with 95 % confidence interval (CI) for receipt of long-term medical benefits at the age of 20 – 29 years according to various health factors measured in adolescence for the entire Young-HUNT1 cohort and within families (logistic regression model conditional on sharing the same biological mother)
|
|
Entire cohort¹
|
|
Sibling cohort²
|
|
Model 1³ OR (95 % CI)
|
|
Model 2⁴ OR (95 % CI)
|
|
Number receiving benefits
|
OR (95 % CI)
|
|
Somatic illnesses (number, 0 – 5)
|
|
|
|
|
|
|
|
|
|
|
One or more vs. none
|
1.6
|
(1.4 – 1.8)
|
|
1.5
|
(1.3 – 1.8)
|
|
98
|
1.3
|
(0.9 – 1.8)
|
|
Somatic symptoms (number, 0 – 8)
|
|
|
|
|
|
|
|
|
|
|
Two or more vs. none or one
|
1.5
|
(1.3 – 1.7)
|
|
1.4
|
(1.3 – 1.6)
|
|
132
|
1.1
|
(0.8 – 1.6)
|
|
Symptoms of anxiety and depression (SCL-5 score, 1 – 4)
|
|
|
|
|
|
|
|
|
|
|
High level (score > 2) vs. low level (score ≤ 2)
|
1.5
|
(1.2 – 1.7)
|
|
1.4
|
(1.1 – 1.6)
|
|
52
|
1.2
|
(0.7 – 2.0)
|
|
Sleep disturbance
|
|
|
|
|
|
|
|
|
|
|
«Frequently/almost nightly» vs. «never/occasionally»
|
1.4
|
(1.1 – 1.7)
|
|
1.3
|
(1.1 – 1.6)
|
|
40
|
1.3
|
(0.8 – 2.2)
|
|
Poor concentration
|
|
|
|
|
|
|
|
|
|
|
«Frequently/very frequently» vs. «never/occasionally»
|
1.4
|
(1.2 – 1.6)
|
|
1.3
|
(1.2 – 1.5)
|
|
95
|
1.3
|
(0.9 – 1.8)
|
|
Self-reported health
|
|
|
|
|
|
|
|
|
|
|
«Fair/poor» vs. «very good/good»
|
2.0
|
(1.7 – 2.3)
|
|
1.8
|
(1.5 – 2.1)
|
|
64
|
2.1
|
(1.3 – 3.4)
|
|
BMI
|
|
|
|
|
|
|
|
|
|
|
Overweight (BMI 25 – 30) vs. normal weight (BMI < 25)
|
1.4
|
(1.3 – 1.8)
|
|
1.4
|
(1.2 – 1.6)
|
|
44
|
1.2
|
(0.8 – 2.0)
|
|
Obesity (BMI > 30) vs. normal weight (BMI < 25)
|
2,0
|
(1,4 – 2,7)
|
|
1,8
|
(1,3 – 2,5)
|
|
11
|
1,1
|
(0,4 – 2,7)
|
|
Smoking
|
|
|
|
|
|
|
|
|
|
|
«Daily/occasionally» vs. «never»
|
1.6
|
(1.4 – 1.8)
|
|
1.4
|
(1.2 – 1.7)
|
|
95
|
1.7
|
(1.1 – 2.6)
|
|
Number of health problems (accumulated health burden)
|
|
|
|
|
|
|
|
|
|
|
One health problem vs. none
|
1.3
|
(1.01 – 1.6)
|
|
1.2
|
(1.05 – 1.54)
|
|
68
|
1.3
|
(0.7 – 2.1)
|
|
Two health problems vs. none
|
1.6
|
(1.3 – 2.0)
|
|
1.5
|
(1.3 – 1.9)
|
|
51
|
1.2
|
(0.7 – 2.2)
|
|
Three health problems vs. none
|
2.2
|
(1.8 – 2.8)
|
|
2.0
|
(1.6 – 2.5)
|
|
38
|
1.8
|
(0.9 – 3.6)
|
|
4 – 8 health problems vs. none
|
3.0
|
(2.4 – 3.8)
|
|
2.6
|
(2.1 – 3.3)
|
|
38
|
2.5
|
(1.2 – 5.2)
|
|
[i]
|
Discussion
Adolescents who reported health problems had an increased risk of illness and work incapacity in young adulthood, measured by receipt of long-term benefits at the age of 20 – 29 years. This association was found for both sexes and for various measurements of health, including somatic illness, somatic symptoms, symptoms of anxiety and depression, poor concentration, sleep disturbances, self-reported health, overweight/obesity and smoking. The associations between health problems and receipt of long-term benefits changed little after adjusting for family-related factors.
The study’s main strengths are its prospective design, high participation rate and almost complete follow-up data. Sibling data also enabled an evaluation of the importance of a shared home environment, although the estimates from these analyses are less accurate due to the reduced statistical strength. We also had information on several different health measures, enabling us to elucidate different aspects of adolescent health. While some of the measures of adolescent health were examined using known, validated variables and scales, other factors such as poor concentration and sleep disturbances were measured using individual items from the Young-HUNT1 questionnaire. Even better information about the adolescents’ health status, with more comprehensive survey tools and information from other sources, would have enhanced the quality of the results.
To the extent to which we have failed to capture all aspects of adolescent health using our measurements, it is reasonable to assume that this has weakened the associations we have found in our analyses. We have accounted for possible confounding by identifying relevant factors, adjusting for these in the analyses and comparing siblings. However, we cannot exclude the possibility that other underlying factors that we have not been able to adjust for may partly explain our results, such as family factors that are not shared by siblings, individual characteristics such as personality and abilities, and exposure to violence and bullying. Days with sickness benefits were calculated per calendar year. It is therefore possible that some long sickness absence periods (> 180 days) that extend over two calendar years are not included in our endpoint. This misclassification is considered to be non-differential and may thereby have resulted in an underestimation of effect measures (5, 6).
The association between adolescent health and later social insurance benefits and participation in the labour market has been relatively little studied. The results from this study point in the same direction as previous studies which have looked at health in early life and later risk of receiving disability pension at a young age. Low birth weight, low gestational age, chronic illness in childhood years (measured by receipt of basic benefit or attendance benefit), mental and somatic symptoms at 11 and 16 years old, and mental disorder registered at conscription (assessment of fitness for military service) are among the early health factors that have been shown to correlate with disability pension at a young age (1, 20 – 24). Those receiving disability pension at a young age only represented between 1 % and 5 % of the study population in these studies, and we must assume that they represent a more marginalised group than those who were identified with long-term benefits in our study (15 %).
We know that the group of young recipients of disability pension in Norway are characterised by serious mental disorders and pervasive conditions (4, 25). However, there is some evidence that vulnerability linked to health at a young age is a more general phenomenon that applies not only to the most marginalised groups. Our results have demonstrated relationships between health in adolescence and young adult outcomes for large groups of young people – including those who do not complete upper secondary school (9) and those with long-term sickness in their twenties. This is also supported by Norwegian registry studies that have demonstrated associations between health and illness in the childhood years (birth weight and receipt of attendance benefit and basic benefit) and more general outcomes in young adulthood (labour market participation at 29 years, low education, disability and economic inactivity) (26, 27). In a cohort study from Northern Sweden, health in adolescence was little related to the number of periods of sickness absence in adulthood (28). These results contrast with the results from our study, and may possibly be explained by the way in which the outcome measure is defined (long-term benefits versus number of periods of sickness absence).
The results from the present study, however, indicate that it is the amount of ill-health rather than the type of health problem that is crucial. Tendencies were identified towards dose-response effects, both for the degree of one single health complaint and of the total health burden. These indicate that health vulnerability applies to the most ill adolescents, but nonetheless that it is those with the most health complaints and the highest reporting of illness who are the most vulnerable. In addition, it appears that the general measures of health, such as number of problems and self-reported health, show the most robust associations with the outcome – irrespective of sex, categorisation of the health variables, type of social insurance benefit and adjustment for confounding factors, including all factors shared by siblings.
In our previous studies, symptoms of anxiety and depression in adolescence have only shown moderate associations with long-term sickness and disability benefits, weaker associations with dropout from lower and upper secondary school, and no association with unemployment (9, 11). We also see in this study that symptoms of anxiety and depression do not appear to differ from other health measurements in terms of identifying individuals or risk groups. This is surprising, considering that mental disorders are the main reason for long-term sickness and disability benefits among young adults, and that anxiety and depression represent the largest diagnostic group among young people on long-term sickness benefits and medical/vocational rehabilitation (3). Although we cannot exclude the possibility that more comprehensive diagnostic tools for mental disorders among adolescents would have been better able to identify individuals at risk, these results may indicate that we should be cautious in focusing exclusively on adolescents with mental symptoms and disorders in the debate on social insurance benefits.
In this study we have observed that reported health problems in both boys and girls represent an increased risk of long-term benefits. The girls reported health complaints more frequently than the boys, particularly with regard to somatic symptoms and symptoms of anxiety and depression, and received more long-term benefits in young adulthood. However, there were only slight differences between the sexes with regard to the association between health problems and long-term social insurance benefits, with a tendency towards somewhat stronger associations in boys for reported poor concentration, sleep disturbances and smoking.
The results from this and previous studies support the notion that in the current Norwegian welfare system, selection for occupational and educational status occurs at a young age, and partly based on health (9, 11). Results from analyses adjusted for the family’s socioeconomic background as well as sibling analyses indicate that the association with health in adolescence is not only the result of social background factors, but also of a health selection process. Poor health entails an increased risk of low education and early labour market exclusion. In their turn, low education and early labour market exclusion entail an increased risk of poor health, both at the individual and population level, and for greater health inequalities (29). It is therefore necessary to take account of the relation between the health resources of young employees, on one hand, and the demands of the labour market on the other (27). Our experiences from clinical practice in social medicine also indicate that it is difficult for persons who are not in good health to gain access to the labour market. The prevention of health selection and avoidance of larger health inequalities should be a priority in planning the welfare and labour market policies of tomorrow.
Conclusion
Health impairment in adolescence is a clear indicator of increased vulnerability in the transition to adulthood and of ending up as a recipient of long-term health-related benefits. Nevertheless, there are reasons to assume that complex mechanisms underlie these associations. The results from this study point to the difficulty of identifying specific health factors at the population level that might be used for screening or early detection and intervention. We therefore believe that a holistic perspective should be taken of child and adolescent health and vulnerability in the prevention of incapacity and exclusion at a young age, and provisions made to help young people to live in a better way with their health complaints.
