Acute poisonings represent a major health problem in Norway. In the period 1999 – 2004, nearly 11 000 hospital admissions and approximately 500 deaths could be related to acute poisonings each year (1). Not all of them are equally dramatic, and many of them are resolved through contact with the Poison Information Centre (2–4). Many cases of poisoning are also dealt with by ambulance services and primary care out-of-hours services (5).
Various registers have been used to identify poisonings in Norway. The Cause of Death Registry, the Norwegian Patient Registry and statistics on inquiries to the Poison Information Centre were deemed the most suitable sources (6). Analyses of case histories collected from hospitals were also undertaken (7). In Oslo, prospective studies have also been undertaken by ambulance services, A&E clinics and hospitals (5, 8, 9). Prospective studies produce data of better quality, but are challenging to undertake, especially on a nationwide basis and over a long time. The city of Oslo is hardly representative of the other parts of the country. It is therefore relevant to use methods that are simpler than prospective studies and data that are more easily available to form an impression of the situation prevailing nationwide.
Over a ten-year period (2006 – 15), the National Centre for Emergency Primary Health Care has prepared statistics based on reimbursement claims from the out-of-hours services (10). These statistics show that poisonings have increased in frequency through this period, but the data have not been made subject to a closer analysis. The objective of this study was to analyse poisonings treated in Norwegian out-of-hours services on the basis of this material.
Material and method
The material consists of data from all electronic reimbursement claims submitted by doctors on out-of-hours duty in the period 2006 – 15. We have placed special emphasis on the first and last years to elucidate the development over this ten-year period. Paper-based reimbursement claims and claims paid to the patient if the doctor has no agreement on direct payment are not included in the material. These have been estimated to account for 4.9% of all contacts with out-of-hours services in 2006 and less than 1% in 2010 (11, 12).
Anonymised data files were supplied by the Norwegian Health Economics Administration’s office for control and payment of healthcare reimbursements. For 2015, patients with a national identification number have been allocated a unique ID code that permits identification of recurring cases. The contact rates are based on population data from Statistics Norway.
The variables in the material included the patient’s gender and age, time of contact, diagnostic codes (ICPC), fee codes and municipality (grouped). The time of contact was categorised as daytime (08:00 – 16:00), evening (16:00 – 24:00) or night time (00:00 – 08:00). Saturdays and Sundays were categorised as weekend. After having grouped all cases of poisoning by age, we chose to concentrate on three age groups that stood out in having especially high rates of contact and/or major changes from 2006 to 2015: 1 – 2 years, 15 – 25 years and 53 – 59 years.
Information on gender was missing for 3.8% of the contacts related to poisoning in 2006 (6.3% in the age group 1 – 2 years, 4.3% in the age group 15 – 25 years and 2.1% in the age group 53 – 59 years). The estimates of contact rates have been adjusted for this, since we assumed that the frequency of missing information on gender was independent of actual gender.
We have no information on municipality numbers, but the municipalities have been grouped by number of inhabitants and centrality. Centrality is defined as a municipality’s geographic location in relation to a population centre where higher-order functions (central functions) are available. Centrality is ranked on a scale from 0 to 3, where 0 are the least central and 3 the most central municipalities (13).
A contact with out-of-hours services was defined as a consultation (fee codes 2ad, 2ak, 2fk), home visit (11ad, 11ak) or telephone contact (1bd, 1bk, 1g). To identify contacts with out-of-hours services due to poisonings we used the following ICPC codes: A84 poisoning by a medical agent; A86 toxic effect non-medicinal substance; and P16 acute alcohol abuse.
The annual statistics for primary care out-of-hours services were assessed by the data protection officer in the Norwegian Labour and Welfare Administration (NAV) and the Data Protection Official for Research (10). Since no individuals can be identified either directly or indirectly in the material, the project was not subject to duty of notification pursuant to the Personal Data Act.
Since the material encompasses all electronic reimbursement claims and not a sample, the differences identified are real and not fraught with any statistical uncertainty. The data are therefore presented without any confidence intervals, and no statistical tests have been undertaken.
Results
The rate of contact caused by poisoning increased for both women and men during the period (Figure 1). The number of poisonings caused by medical agents increased less than the number of other poisonings (Figure 2).
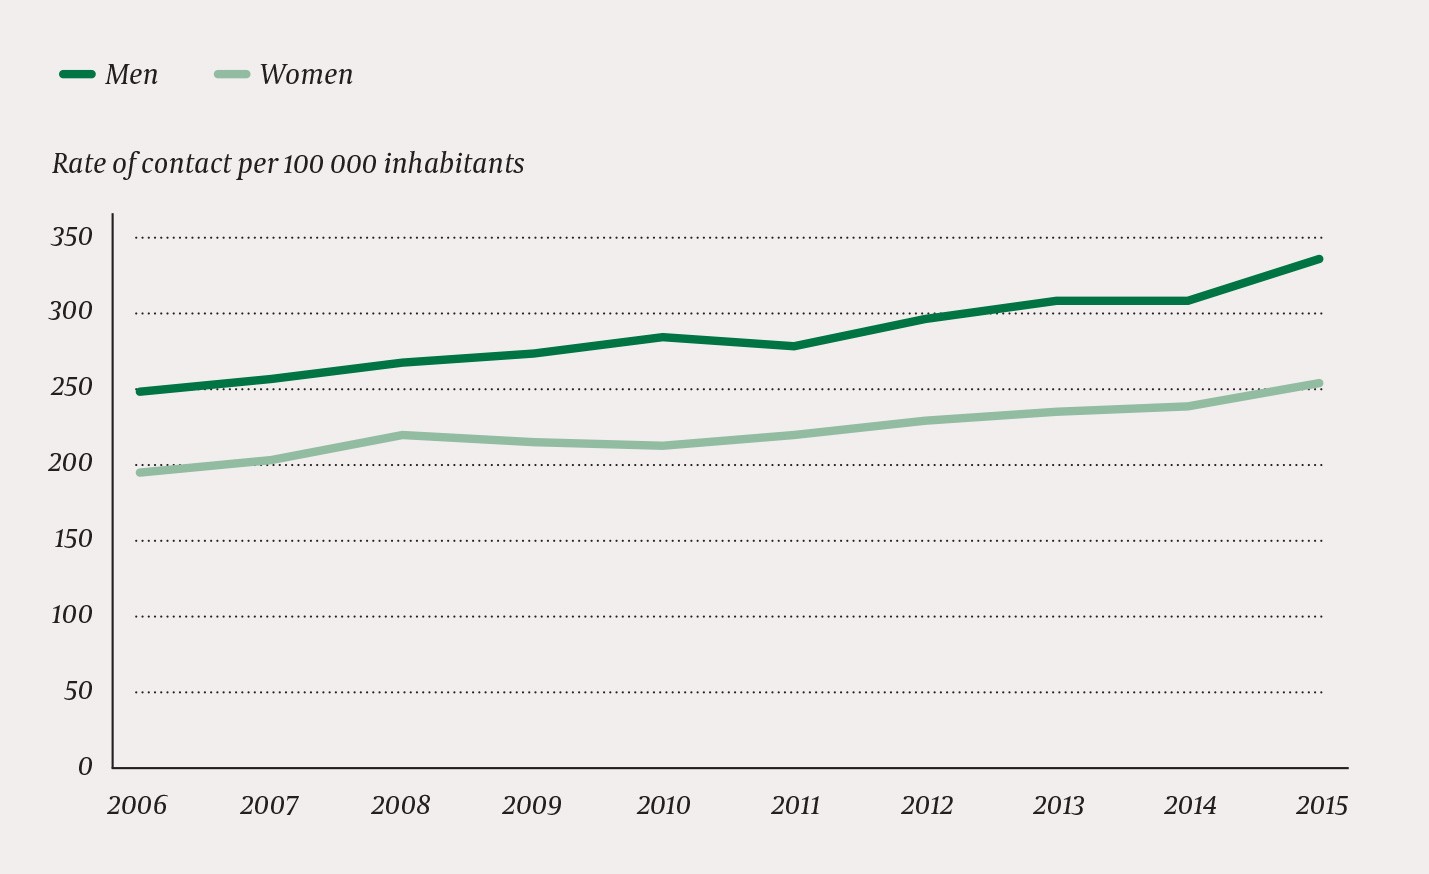
Figure 1 Rates of contact with out-of-hours services due to poisoning in the period 2006 – 2015, by gender
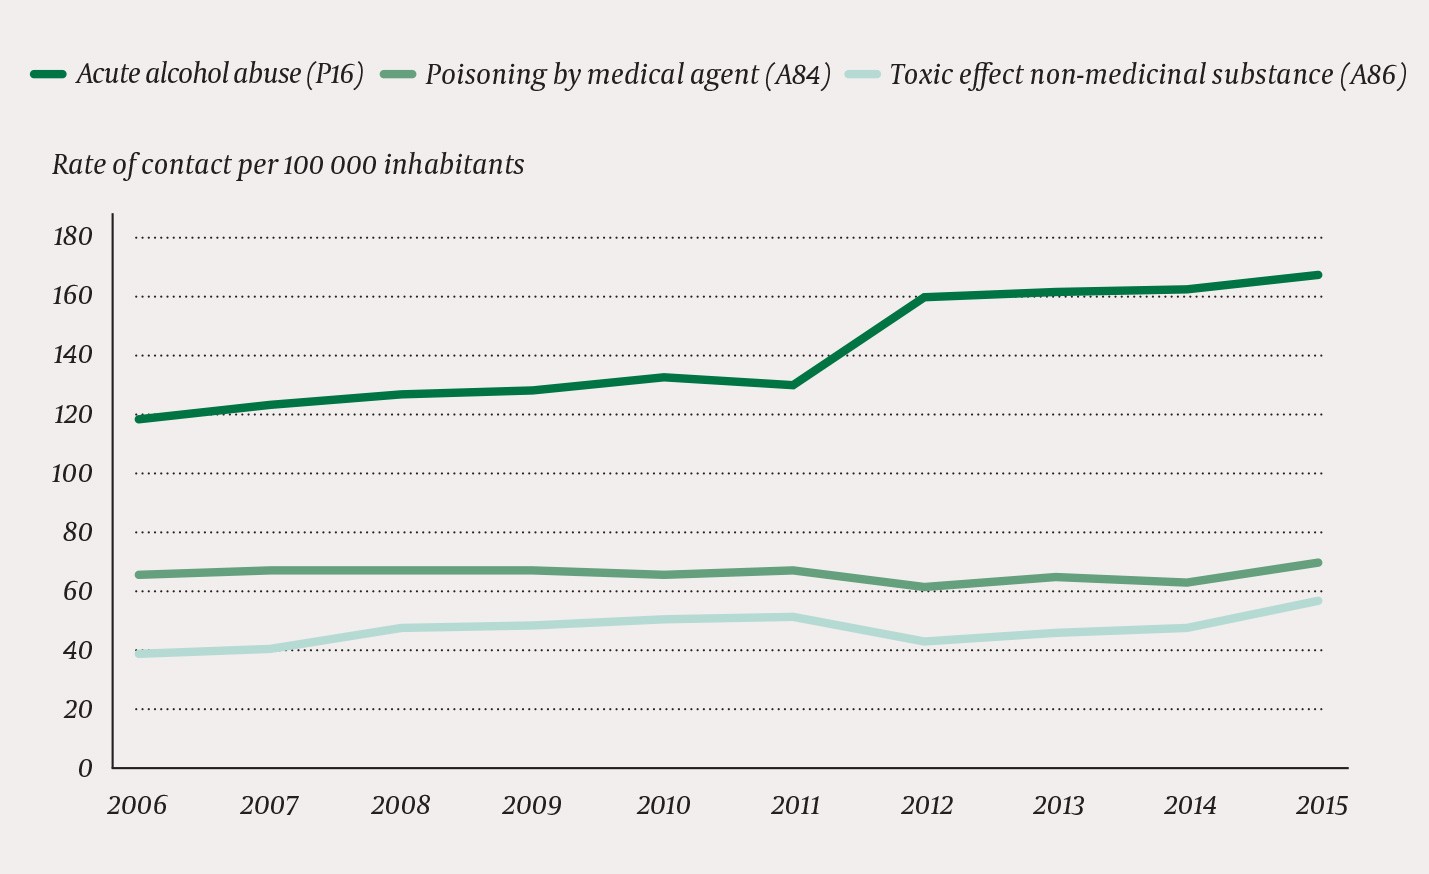
Figure 2 Rates of contact with out-of-hours services due to poisoning in the period 2006 – 15, by different diagnoses
In 2006, altogether 35% of the population called on out-of-hours services. By 2015, this proportion had grown to 38%, i.e. a relative increase of 9% (Table 1). The rate of contact for poisonings amounted to 221 per 100 000 inhabitants in 2006, and 297 per 100 000 inhabitants in 2015, a relative increase of 34%. In 2006, altogether 67% of the contacts recorded due to poisoning led to a consultation in the out-of-hours clinic and 10% led to a home visit, whereas in 2015, the corresponding figures were 79% consultations and 8% home visits.
Table 1
Number of contacts to out-of-hours services in 2006 and 2015, all diagnoses and different poisoning diagnoses
|
|
Consultations
|
|
Home visits
|
|
Telephone contacts
|
|
Total
|
|
|
2006
|
2015
|
|
2006
|
2015
|
|
2006
|
2015
|
|
2006
|
2015
|
|
All diagnoses
|
1 238 791
|
1 342 521
|
|
92
543
|
63
192
|
|
278 650
|
497 480
|
|
1 609 984
|
1 903 193
|
|
All poisonings
|
6 864
|
12 045
|
|
1 000
|
1 156
|
|
2 367
|
2 132
|
|
10 231
|
15 333
|
|
A84
Poisoning by a medical agent
|
1 717
|
2 424
|
|
366
|
404
|
|
975
|
796
|
|
3 058
|
3 624
|
|
A86 Toxic effect non-medicinal substance
|
1 220
|
2 503
|
|
99
|
182
|
|
405
|
307
|
|
1 724
|
2 992
|
|
P16 Acute alcohol abuse
|
3 927
|
7 118
|
|
535
|
570
|
|
987
|
1 029
|
|
5 449
|
8 717
|
The largest changes in the contact rates were observed in the age groups 1 – 2 years, 15 – 25 years and 53 – 59 years (Figure 3). Table 2 shows the total and percentage-wise changes in poisoning-related contact rates by gender in the three age groups. Men had the highest rate of contact in most age groups, but women were overrepresented in the age group 13 – 21 years (Figure 4).
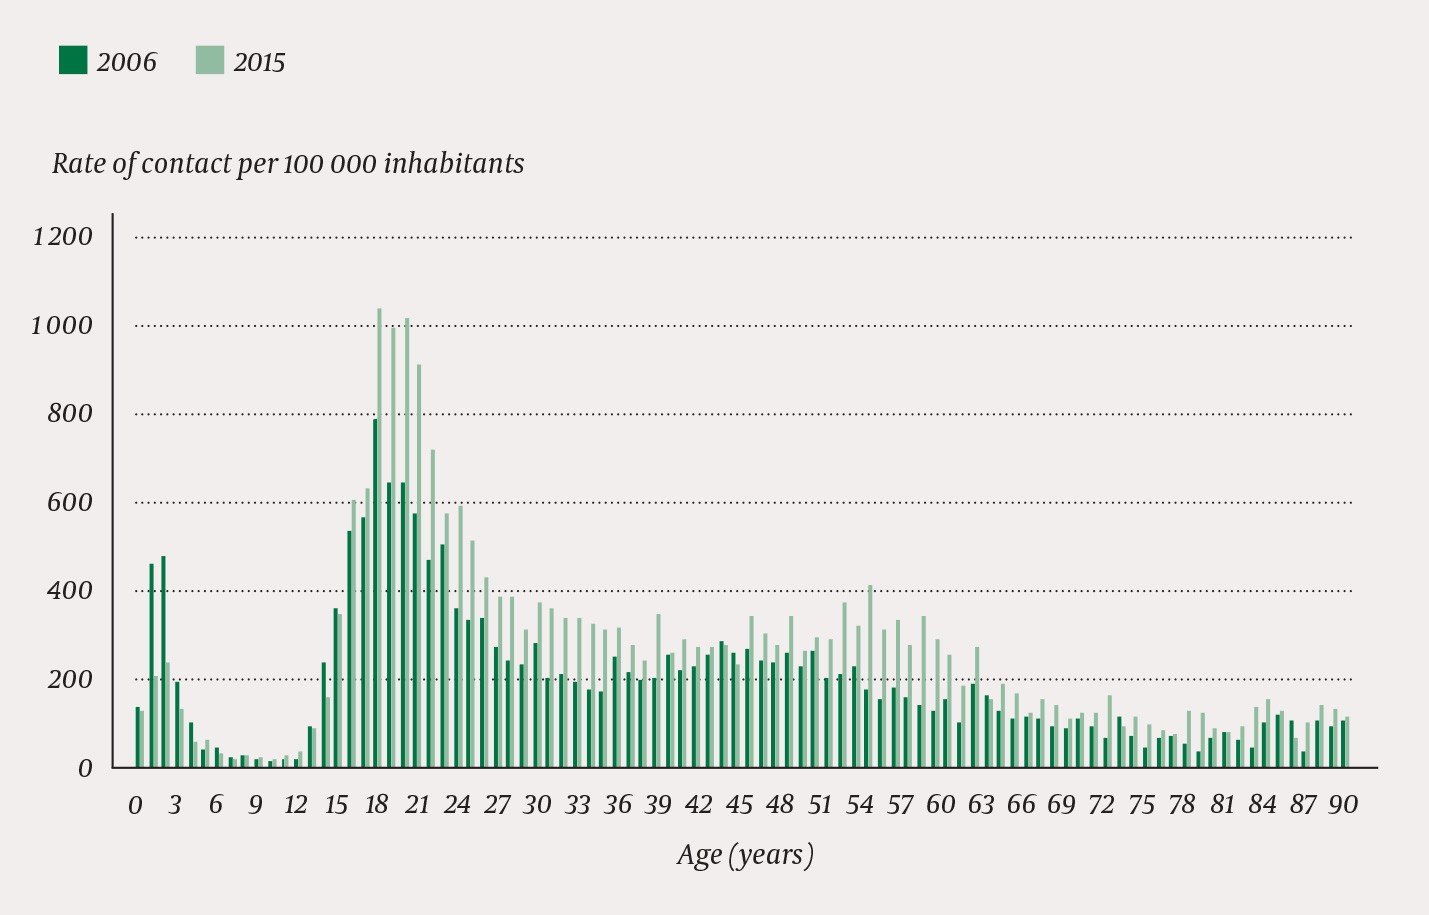
Figure 3 Age distribution of rates of contact with out-of-hours services due to poisonings in 2006 and 2015
Table 2
Contact rates (per 100 000 inhabitants) with out-of-hours services in Norway due to poisonings in 2006 and 2015, by gender and age group
|
Age
(years)
|
Women
|
|
Men
|
|
2006
|
2015
|
Percentage change
|
|
2006
|
2015
|
Percentage change
|
|
1 – 2
|
406
|
194
|
- 52
|
|
525
|
250
|
- 52
|
|
15 – 25
|
564
|
785
|
+ 39
|
|
481
|
657
|
+ 37
|
|
53 – 59
|
119
|
188
|
+ 58
|
|
235
|
484
|
+ 106
|
|
All
|
194
|
255
|
+ 31
|
|
247
|
338
|
+ 37
|
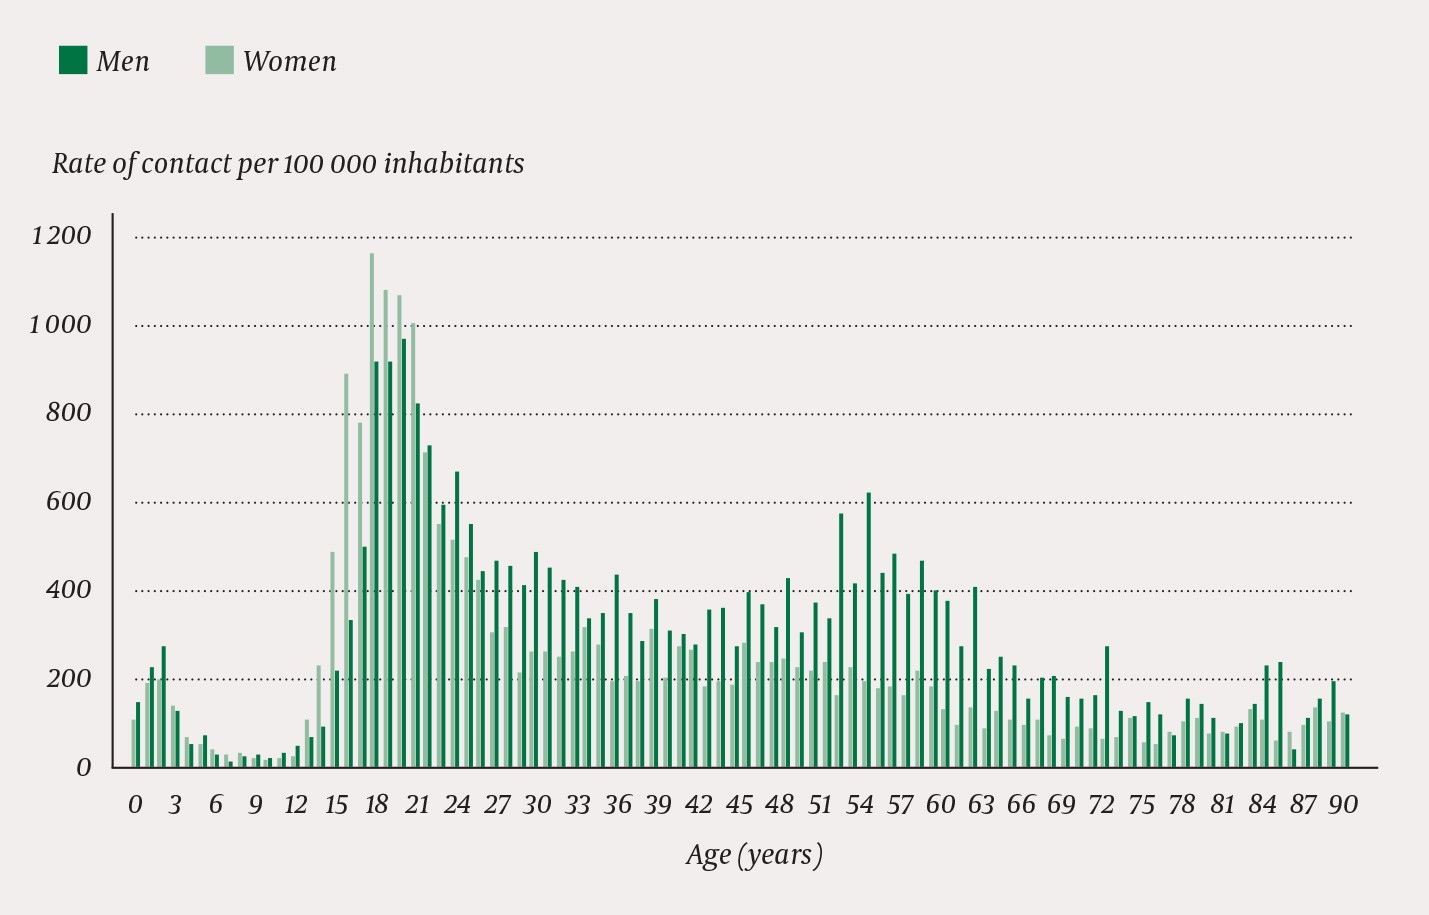
Figure 4 Age distribution of contact rates with out-of-hours services due to poisonings in 2015, women and men
Young women in the age group 15 – 25 years stood out with a high rate of contact due to poisoning by a medical agent (Table 3). Acute alcohol poisoning occurred very frequently in both men and women in the age group 15 – 25 years, but in the age group 53 – 59 years, intoxication occurred 4.4 times more frequently in men than in women.
Table 3
Rates of contact (per 100 000 inhabitants) due to different types of poisonings in 2015, by gender and age group
|
Age
(years)
|
Poisoning by a medical agent (A84)
|
|
Toxic effect non-medicinal substance (A86)
|
|
Acute alcohol abuse (P16)
|
|
Women
|
Men
|
|
Women
|
Men
|
|
Women
|
Men
|
|
1 – 2
|
94
|
102
|
|
101
|
144
|
|
0
|
3
|
|
15 – 25
|
238
|
77
|
|
113
|
111
|
|
434
|
469
|
|
53 – 59
|
27
|
25
|
|
17
|
35
|
|
40
|
176
|
|
All
|
90
|
51
|
|
47
|
69
|
|
119
|
218
|
In the age group 15 – 25 years, the cases of poisoning occurred disproportionately during the night and on weekends when compared to all contacts with out-of-hours services (Table 4). Cases of poisoning in the age group 53 – 59 years also occurred disproportionately during the night, but not on weekends. Both age groups were moderately overrepresented in the largest municipalities. Cases of poisoning in the youngest children had approximately the same distribution as all contacts with out-of-hours services, in terms of their time of occurrence well as their geographical location.
Table 4
Percentage distribution of contacts with out-of-hours services in Norway by time of occurrence (time of day, week) and geographical location (centrality, number of inhabitants). Poisonings compared to all contacts (2015)
|
|
Poisonings
|
|
All contacts
|
|
Age 1 – 2 years
(n = 272)
|
Age
15 – 25 years
(n = 5 337)
|
Age 53 – 59 years (n = 719)
|
|
(N = 1 903 193)
|
|
Time of day
|
|
|
|
|
|
|
Night (00:00 – 08:00)
|
6
|
63
|
29
|
|
12
|
|
Day (08:00 – 16:00)
|
30
|
8
|
15
|
|
30
|
|
Evening (16:00 – 24.00)
|
64
|
29
|
56
|
|
58
|
|
|
|
|
|
|
|
|
Week
|
|
|
|
|
|
|
Weekday
|
63
|
42
|
62
|
|
61
|
|
Weekend (Sat/Sun)
|
37
|
58
|
38
|
|
39
|
|
|
|
|
|
|
|
|
Centrality
|
|
|
|
|
|
|
0 (least central)
|
15
|
10
|
11
|
|
13
|
|
1
|
10
|
8
|
6
|
|
7
|
|
2
|
26
|
26
|
24
|
|
27
|
|
3 (most central)
|
49
|
56
|
59
|
|
53
|
|
|
|
|
|
|
|
|
Number of inhabitants in the municipality
|
|
|
|
|
|
|
< 2 001
|
1
|
1
|
2
|
|
2
|
|
2 001 – 5 000
|
9
|
5
|
6
|
|
7
|
|
5 001 – 10 000
|
11
|
7
|
5
|
|
9
|
|
10 001 – 50 000
|
52
|
41
|
40
|
|
47
|
|
> 50 000
|
27
|
46
|
47
|
|
35
|
Poisonings in small children were more frequently dealt with as a telephone contact when compared to poisonings in other age groups (Table 5). Of the different types of poisonings, those caused by a medical agent were most frequently dealt with over the telephone.
Table 5
Proportion (%) of different types of poisonings that were dealt with as a telephone contact in Norwegian out-of-hours services in 2015. The percentage is calculated for each gender and age group
|
|
Poisoning by a medical agent
|
|
Toxic effect non-medical substance
|
|
Acute alcohol abuse
|
|
Total (all poisonings, both genders)
|
|
Age
(years)
|
Women (n = 518)
|
Men (n = 278)
|
|
Women (n = 138)
|
Men (n = 169)
|
|
Women (n = 378)
|
Men (n = 651)
|
|
(N = 2 132)
|
|
1 – 2
|
27
|
22
|
|
32
|
26
|
|
-
|
-
|
|
26
|
|
15 – 25
|
16
|
15
|
|
8
|
9
|
|
10
|
10
|
|
11
|
|
53 – 59
|
26
|
26
|
|
13
|
9
|
|
20
|
15
|
|
17
|
|
All
|
23
|
21
|
|
12
|
10
|
|
12
|
12
|
|
13
|
In 2015, altogether 14 973 of the patients (98%) who had been in contact with out-of-hours services because of poisoning were allocated a unique identification number. Of these, a total of 10 078 patients (86%) had only one contact and 1 684 patients (14%) two or more contacts. In the age group 15 – 25 years, altogether 12% of the patients who had been registered with an acute poisoning had two or more contacts, in the age group 53 – 59 years, altogether 23% had two or more contacts. Of the youngest children, only 2% had more than one contact because of poisoning.
Discussion
This study confirms the findings of other studies, which also show that the number of poisonings in Norway is increasing (1, 4). It emerges, however, that there are major variations associated with age groups and gender. There has been a large and welcome reduction in the number of inquiries to out-of-hours services regarding poisonings in small children.
Reimbursement claims are prepared for all contacts with out-of-hours services, and we may therefore assume that all inquiries have been registered. There is also reason to assume that the information on gender, age, home municipality, time of inquiry and fee codes is correct.
The use of diagnostic codes is fraught with more uncertainty. Different doctors may have different interpretations regarding the choice of diagnostic code. Even though formal criteria for the use of the different codes are available, some may fail to check these inclusion and exclusion criteria in their daily clinical activities. For example, we may imagine that some doctors will use the diagnostic code P19 (drug abuse) when encountering patients who have been poisoned by illicit drugs such as heroin, amphetamine and GHB. We have not included this diagnosis, since its scope is much wider than poisonings. This may have caused poisonings by illicit drugs to be underrepresented in the material.
This lack of diagnostic precision is likely to be evenly distributed through the material, and we therefore believe that the differences registered between various groups and over time still remain valid, although in a somewhat diluted form.
There is reason to believe that the large cities differ from the rest of the country in a number of ways, but out of concern for privacy we have no information on affiliations with particular municipalities in our material. We have therefore been unable to calculate contact rates for different municipalities or regions. The A&E clinics in Oslo and Bergen have separate departments that deal with patients who have been poisoned by alcohol or drugs. In other parts of the country these patients may have been brought directly to hospital and thus escaped registration in our material. Moreover, the emergency ward at the Bergen A&E clinic is part of the specialist health services and thus also excluded from our material.
We have no overview of the degree of seriousness of the registered poisonings or what subsequently happened to the patients. Most deaths from poisoning occur outside hospitals and are caused by narcotic substances, most often heroin and various combination poisonings (1, 14, 15). These types of poisonings are most often dealt with by ambulance personnel. In many cases of poisoning the patient is also admitted to hospital directly without going through the out-of-hours services. In the years 2003 – 04, the Oslo ambulance service drove 28% of the patients directly to hospital and 31% directly to the A&E clinic. Of those who were taken to the A&E clinic, 16% were admitted to hospital (5).
The Oslo A&E clinic registered a doubling of the number of poisonings (in patients older than 12 years) in the period 2003 – 08 (8). We find that the total rate of contact with out-of-hours services due to poisoning has increased by 34% over the ten-year period 2006 – 15. The slower rate of increase in our material can be explained by the strong reduction in the number of poisonings in the youngest children, but it is also likely that increasing drug abuse will have a greater impact in a large city. We found that such poisonings were overrepresented in the largest municipalities.
Another study from Oslo found that the incidence of poisoning in children younger than 15 years, registered by hospitals and out-of-hours services, decreased from 230 per 100 000 inhabitants in 1980 to 97 per 100 000 inhabitants in 2003 – 05 (9). The incidence was highest in one-year-old boys (576 per 100 000 inhabitants), but extremely low in the age group 5 – 9 years (12 per 100 000). These figures accord well with our material, which shows that the strong reduction among the youngest children has continued through the last ten years.
This trend is likely to have a number of causes: information campaigns, individual prevention under the auspices of the mother and child clinics, more safety-minded parents, childproofing of dangerous bottles and cans, foul-tasting additives, removal of poisonous products etc. For example, in the period from 1980 to 2003 – 05, a 96% reduction in tobacco poisonings was recorded in children in Oslo (9).
Many of the poisoning accidents involving small children are relatively harmless and are frequently resolved with the Poison Information Centre without any contact between the child and the health services. This can be illustrated by the numerous telephone contacts that applied to this age group. For 2004 – 06, the Poison Information Centre registered approximately 35 000 inquiries regarding chemical products, whereof 38% concerned children aged 1 – 4 years, and 86% were assessed as harmless (2). Most likely, the increasing number of inquiries to the Poison Information Centre may explain the declining number of contacts with the health services (4).
In the Oslo A&E clinic, altogether 63% of the cases of poisoning involved men, most often with overdoses of alcohol and drugs (8). In our material, men had a 30% higher contact rate in both 2006 and 2015, with alcohol as the predominant cause. In addition, we should take note of the strong increase in the rate of contact due to poisonings among the middle-aged (the age group 53 – 59 years), primarily caused by the use of alcohol among men. This age group also contained a number of recurring patients. It is well known that poisonings are most prevalent in groups with poor living conditions, especially homeless people (16, 17). Possibly, alcoholics and the homeless are overrepresented among these recurring patients.
In the Oslo A&E clinic, poisoning by a medical agent was especially prevalent among young women (8). We made the same finding. With the exception of the very youngest children, contacts because of poisoning by a medical agent occurred more frequently for women than for men, and in the age group 15 – 25 years such poisonings occurred three times more frequently in women. More than 60% of all hospitalisations due to poisoning are caused by medical agents (14), and women are overrepresented in this group, young women in particular (7, 18).
While the poisonings in infants in terms of geography and time were distributed approximately equally to other contacts with the out-of-hours services, poisonings in adolescents were strongly overrepresented at night. Similar to the Oslo A&E clinic, we also found that these poisonings occurred more frequently during weekends (8). This corroborates our impression that poisonings in adolescents are largely associated with alcohol and substance abuse.
Cases of poisoning that are dealt with as telephone contacts must be assumed to be trivial. In addition to the fact that infants were overrepresented in this group, we also found relatively many telephone contacts that involved poisonings by a medical agent. In contrast to other substances, the amount of medical agent ingested will often be known, thus making it easier to ascertain whether the dose involved was harmless.
Conclusion
The rate of contact with out-of-hours services due to poisonings has increased during the last decade, but there are considerable variations in terms of gender and age. As regards the youngest children, the frequency has more than halved. Young women stand out as group with especially frequent cases of poisoning by medical agents.
