Measurements of European populations have shown a slow, positive trend in children’s growth – with a gradual increase in final height by 0.3 – 3 cm for every decade (1 – 3). This development is mainly due to better nutrition, improved socio-economic conditions and fewer infections (4). In addition to observing the development in children’s height, it will also be important to follow the development in weight, especially because obesity has become more prevalent in children and adolescents (5). Regular updates of national weight references ensure that the weight charts used by health personnel represent healthy children in the population and are in line with the health authorities’ recommendations at all times (6). To control for variations between population groups, it has been common to develop growth charts specific to ethnic groups and nations. Alfred Sundal developed the first Norwegian growth chart in the 1950s (7, 8), while the charts in current use are based on data collected in the 1970s and 80s (9).
In the period 2003–2006, 8 299 children between 0 and 19 years of age were measured as part of the cross-sectional Bergen Growth Study. One aim of the study was to collect reference data to be used as a basis for development of clinically relevant and up-to-date growth charts. A first analysis of the data showed that there had been a definite increase in height (10). This supported the claim that existing growth charts needed updating.
In 2006, WHO published a growth standard for children between 0 and 5 years, which was recommended for international use (11). The standards – based on measurements of children from six countries (including Norway) – were developed under the assumption that children who are raised under good conditions grow similarly the first years of their lives irrespective of their genetic predisposition (12). These charts have previously been described in the Journal of the Norwegian Medical Association (13).
The purpose of this article is to present growth charts for children (0 and 19 years old) based on data from the Bergen Growth Study and the Medical Birth Registry of Norway, and compare these with Norwegian growth charts in current use and the international WHO growth standards.
Material and methods
The Bergen Growth Study
Child population. All growth measurements were performed in the period 2003–2006 for the Bergen Growth Study, a cross-sectional study that included 8 299 children (ages 0–19). 936 children – with one or both parents from outside Northern Europe – and 85 children with chronic diseases or prematurity were excluded. 7 291 children (3 756 boys and 3 535 girls) formed the basis for the growth charts; 2 736 of them were under five years. Bergen municipality recruited children through random stratified selection from health centers for youth (n = 8), kindergartens (n = 34) and schools (n = 24, including 19 elementary/primary and/or middle schools and five secondary/high-schools). All children were invited to participate, but the only children who were measured were those whose parents (or the child itself) had signed an agreement form. In the health centers, about 98 % of the available children were measured. Participation was 57 % in kindergartens, 69 % in primary schools (grades 1–7), 53 % in middle schools (grades 8–10) and 45 % in secondary schools (grades 11–13). Factors that contributed to non-participation were part-time kindergarten attendance, kindergarten activities, exam days in schools, or non-attendance due to travelling or illness, as well as some cases in which children or parents did not wish to participate.
Data were retrieved from the Medical Birth Registry of Norway on birth weight, length at birth, and head circumference for 12 576 children born alive between the 37th and the 42nd gestational week, without abnormalities in the period 1999 – 2003, and who had a mother registered in Bergen. Children registered as descendants of immigrants were excluded. For the growth chart on children 4 – 19 years, reference data were added for puberty development. These are the most recent puberty data from Scandinavia, based on measurements of 1 925 Danish boys and girls ages 6 – 19.9 from the Copenhagen area from 1991 – 1993 (14).
Measurements. 12 nurses and one pediatrician performed all measurements by using a standardized technique(15). The measurements were taken between 8: 30 am and 1 pm and the data were entered directly into a database on a portable computer.
Quality control. The instruments used to measure height and length were checked at the beginning of each day. The scales in the health centres were controlled twice a year and those in schools and kindergartens were checked every time they were moved. Twice a year, all study participants met for a weighing session, where ten children were measured twice by everyone. After that, intra- and inter-observer variation was assessed, with calculation of technical error of measurements (16).
Statistical analysis. SPSS 11.5 software (2003, SPSS Inc., Chicago, IL) and R version 2.3.1. (2006, R Foundation for Statistical Computing, Vienna) were used for data analysis. The growth model LMS by Cole&Green was used to help create the growth charts (17), which were drawn in R.
Ethics and approval. The regional medical research ethics committee in Western Norway assessed the study and did not object to its performance, the Norwegian Data Inspectorate granted a concession.
Other Norwegian growth charts
Sundal’s first growth charts were based on a study performed in Bergen in the period 1950 – 1956. Length/height and weight was measured for 17 795 children between 0 and 17 years (8). Percentiles based on Sundal’s data have been included in the figures in this article to illustrate trends in growth, but mathematical comparisons have not been made.
Norwegian growth charts in current use are based on data from 3–17 year-old children from Bergen recorded by Waaler in the years 1971–1974 (18), as well as on data from 0–4-year-old children from Oslo and Hedmark (SYSBARN Study) recorded in the period 1982–1984. Data from the Medical Birth Registry from the same period were also used (19). The SYSBARN study used length/height, weight and head circumference measurements of 23 669 children (ages 0–4 years) from routine examinations in Oslo and Hedmark (19). Waaler´s study was a mixed longitudinal study that included data for height, weight and head circumference of 3 068 children (ages 3–17 years). For many of those children height and weight were measured up to four times. The total number of measurements in this study was therefore 8 414 (18).
WHO growth standard
WHO’s international growth charts for the ages 0 – 5 years are based on measurements of totally 7 551 children; 1 687 Norwegian children, and children from Brazil, Ghana, Oman and the United States (20). A priority during data collection was to reduce the factors known to have a negative effect on growth. Therefore, criteria such as beneficial socio-economic circumstances, good nutrition (only or mainly breast-feeding for four months and a total breast-feeding period of at least 12 months), as well as a non-smoking mother were required (13).
Comparison
For the ages 0 – 19, our growth charts were compared with percentiles in the SYSBARN study (0 – 4 years), Waaler’s study (4 – 17 years), and the WHO study (0 – 5 years). As growth models were not used to develop charts in the Sundal and Waaler studies, the figures show somewhat irregular percentile lines. In the SYSBARN study, data were used from nine measurement points in children between 0 and 49 months. Sundal and Waaler use data from measurements taken at annual intervals, and the Bergen Growth Study and WHO use data from monthly measurements. Weight at birth and 2.5-, 50- and 97.5 percentiles were compared for the charts in current use. Data from the Bergen Growth Study were used for comparison of weight-for-height (21).
The WHO charts have a little dip at the age of two, which shows the transition from measuring children standing up rather than lying down (11). Norway and many other countries have disregarded this dip. Thus, the charts are not comparable for three months before to three month after two years.
Results
We developed new percentile curves for the ages 0 to 12 months (head circumference, length and weight-for- age), 1 – 5 years (head circumference, length/height and weight-for-age), 4 – 19 years (height and weight-for-age) and 2 – 19 years (body mass index [BMI]-for-age). All charts are available on here. Areas (on the curves) that define values between +2.0 and +2.5 SD and between -2.0 and -2.5, were given a grey colour. On the charts for BMI, cut-off values were indicated for overweight, obesity and underweight.
Comparison with Norwegian charts in current use for 0 – 4 year-olds
Birth weight. The average birth weight for boys in the SYSBARN study was 3 600 g, while that in the new chart is 3 710 g. The corresponding birth weight for girls was 3 500 g in the SYSBARN study and 3 580 g in the new chart.
Length/height (fig 1). Minimal differences were found for this variable when the new charts were compared with those in the SYSBARN study.
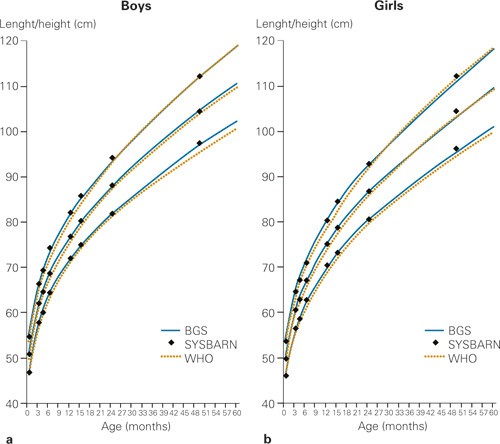
Figure 1 Comparison between length/height-for-age from new Norwegian growth charts (based on the Bergen Growth Study) with that in the SYSBARN study, and WHO’s international growth standard for a) boys and b) girls ages 0 – 5 years. The curves show the 2.5, 50, and 97.5 percentiles
Weight (fig 2). Curves for weight in the new charts for children 15 – 24 months, were below those in the SYSBARN study. The discrepancy was greatest for 15-month-old boys; i.e. at 0.4 kg (2.5-percentile). Values at other measuring points were similar, with the exception of those at the 97.5- percentile for 49-month-old boys, where SYSBARN measurements were 0.6 kg lower than the new curves.
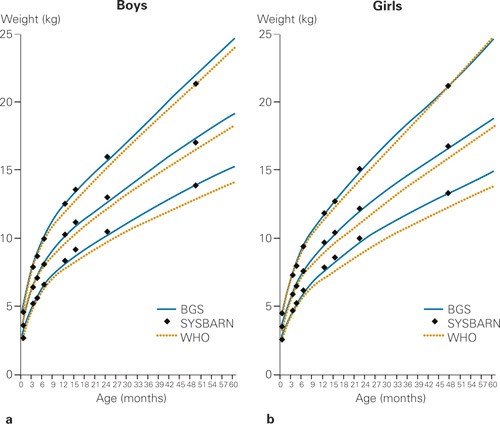
Figure 2 Comparison between weight-for-age from new Norwegian growth charts (based on the Bergen Growth Study) and that in the SYSBARN study and WHO’s international growth standard for a) boys and b) girls ages 0 – 5 years. The curves show the 2.5, 50, and 97.5 percentiles
Head circumference (fig 3). Curves for head circumference in the new charts are below those in the SYSBARN study at all percentiles. Discrepancies for boys are greatest for ages 3 months to 2 years: i.e. 1.0 cm, 0.8 cm, and 1.6 cm, corresponding to the 2.5, 50, and 97.5-percentiles. For girls, discrepancies are greatest for ages 4 months to 2 years: 0.8 cm, 0.9 cm, and 1.2 cm, corresponding to the 2.5, 50, and 97.5- percentiles.
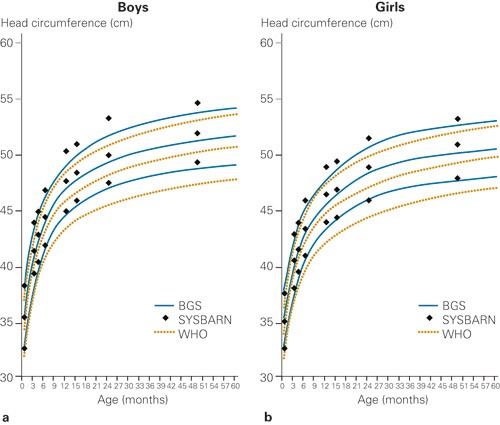
Figure 3 Comparison between head circumference-for-age from new Norwegian growth charts (based on the Bergen Growth Study) and that in the SYSBARN study and WHO’s international growth standards for a) boys and b) girls ages 0 – 5 years. The curves show the 2.5, 50, and 97.5 percentiles
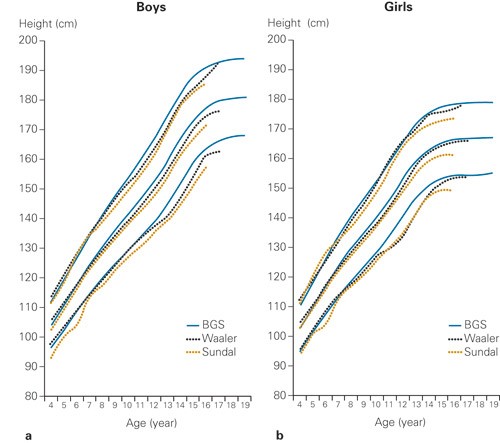
Figure 4 Comparison of height-for-age from new Norwegian growth charts (based on the Bergen Growth Study) with that from Sundal’s study, and Waaler’s study for a) boys and b) girls 4 – 19 years. The curves show the 2.5, 50, and 97.5- percentiles
Comparison with Norwegian growth charts in current use for 4 – 17-year-olds
Height. In our data, boys are 0.9 cm and girls are 0.6 cm taller (average increase) than in Waaler’s data. Percentiles for the new data were higher than those in Waaler’s data, except for children younger than 6 – 7 years. The largest differences were found in the older children and adolescents. The differences found were: height at the 50-percentile up to 3.4 cm for boys and 2.5 cm for girls) and that at the 2.5-percentile was greatest during puberty (4.5 cm for boys and 7 cm for girls). Percentiles from Sundal’s material were included in figure 3 to show trends in height development.
Weight. In our material, 8 % of boys and 7.2 % of girls aged 4 – 15 years, were above the 97.5- weight-for-height percentiles in Waaler’s study (21). Weight-for-age curves were not compared as they are influenced by height development at that age.
Comparison with WHO standards for the age group 0 – 5 years
Birth weight. The average birth weight in the WHO study was 3 300 g for boys and 3 200 g for girls; i.e. 410 and 380 g less than in our study. The average birth weight for Norwegian children (52.4 % boys) – both sexes – in the WHO study was 3 640 g. The corresponding figure from the Norwegian Medical Birth Registry was 3 645 g (51.1 % boys).
Length/height (fig 1). The length/height curves for children in our study are over those in the WHO study for all age groups, except at the 97.5- percentiles for height-for-age in children older than three years. Boys and girls between 2 and 5 years are on average 1.2 % and 1.3 % below -2.0 SD (2.3- percentile) in the WHO curves for length/height-for-age. The difference is up to 1.2 cm for boys (49 months) and 1.1 cm for girls (16 and 60 months respectively). In the WHO material, 2.2 % of boys and 2.1 % of girls are above +2.0 SD (97.5- percentile). It is also worth noting that growth of Norwegian children included in the WHO study is more similar to that shown in our charts than that shown by the overall WHO data. This is especially the case for ages 0–2 years (fig 5).
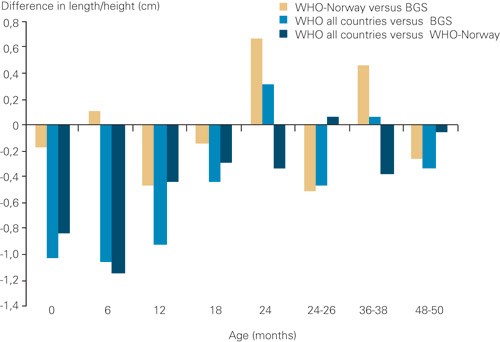
Figure 5 Difference in average height between new Norwegian growth charts (based on the Bergen Growth Study), the Norwegian children included in WHO data (WHO-Norway,) and overall WHO data (WHO- all countries). Differences at 24 months and at 24 – 26 months are influenced by different ways of handling the transition from measuring children’s height lying down to standing up. The data can therefore not be compared directly. Both sexes are included in the presentation
Weight (fig 2). With the exception of birth weight, weight development is similar up to six months. Thereafter, the new curves remain below the WHO growth curves – except at the 97.5 percentile for older girls, where the lines cross. For children 2 – 5 years, 0.45 % of boys and 0.27 % of girls are below –2.0 SD (2.3- percentile) in the WHO curves. The difference is up to 1.0 kg for boys (49 months) and 1.1 kg for girls (60 months). Accordingly, 3.8 % of boys and 3.2 % of girls are above +2.0 SD (97.7 percentile) of the WHO curves. As WHO has not published their data on weight for each participating country individually, it is impossible to compare the Norwegian weight data from the WHO study with our data. Data comparison is also difficult because data from the heaviest children were not included in the WHO study (22).
Head circumference (fig 3). Curves for head circumference are clearly below the WHO chart at all percentiles. Discrepancies, for boys and girls, are largest at two years: for boys 1.5 cm at the 2.5 percentile, 1.2 cm at 5.0 and 0.8 cm at the 97.5 percentile; for girls 1.6 cm at the 2.5 percentile, 1.3 cm at the 5.0 percentile and 0.9 cm at the 97.5 percentile. Few boys in our data have measurements below the 2.5 percentile in the WHO chart, 6.9 % of the boys have measurements above +2.0 SD (97.7 percentile). Almost no girls are below the 2.5 percentile of WHO, and 5.3 % are above 2.0 SD (97.7 percentile). WHO has not published data for head circumference for each participating country.
Discussion
New data from the Bergen Growth Study show clear tendencies towards increased height and weight of school children during the last 20 years; but for children between 0 and 4 years weight-for-height, birth weight and weight in general have not changed much. Norwegian children are clearly heavier at birth than those included in the total WHO material; with few exceptions they were also taller and heavier in general and had a larger head circumference.
The observed trend in height of Norwegian school children is in accordance with that observed for children in other European countries in the same time period (2, 23). The secular trend in height has been linked to improved nutrition and socio-economic conditions and fewer infections. Such a steady increase over time may continue for many generations before it levels out (2). Height stagnation of Norwegian draftees over the past two decades (24), indicates that the country´s population may be about to reach its genetic potential for growth. The trend towards increasing height – observed since the 1970s – still reflects that growth charts should be updated for use in Norway.
In the SYSBARN study, head circumference was found to be somewhat larger than in the Bergen Growth Study. Different measuring techniques may explain this observation, as weight-for-height and weight were found to be similar in the two studies. In the SYSBARN study, many different investigators measured the variables according to their own routines, while in the Bergen Growth Study a limited number of people used standardized measurement techniques.
The Bergen Growth Study concluded that the average age for onset of menstruation (13.25 ± 1.05 years) had not changed since the earlier Norwegian studies (3). Even though data from American studies have raised suspicion of an earlier onset of puberty (25), European studies have so far not been confirmatory (14, 26). The fact that Norwegian children’s age at onset of menstruation has remained the same, indicates that increased height is not caused by earlier maturation – although an earlier onset of puberty and possibly slower progression cannot be ruled out. Data for puberty development of Danish children, which have been incorporated into our charts, are at the same level as those found in a Danish study from 1964 (14).
Weight-by-age in the Sundal Study (from the 1950s), was only marginally different from that in the Waaler study from the 1970s (18). Over the last couple of decades, child overweight and obesity has risen alarmingly worldwide (5). However, our numbers reveal that an increase in weight only occurs in children older than 5 years – also, it is mostly the heavy children that have become even heavier, which means that the highest percentiles are most affected (21). Therefore, the increase in overweight in the child population mainly affects one subgroup.
This development calls for action at many levels; a sensible general health policy being a good starting point (27). The findings in our study indicate that goal-directed actions targeted at special groups in the child population are the actions most urgently called for.
The observation that older children are becoming taller, renders updating of the charts important; but the increase in weight also stresses that the reference charts should be functional in relation to specific problems of overweight and obesity. In Norway, a rational approach is to use BMI curves with cut-off values for overweight and obesity. Based on that approach, charts have been made with internationally recognized cut-off values for both overweight and obesity, as suggested by the International Obesity Task Force (IOTF) (28). These charts are robust and are not affected by slow trends.
We consider the differences between the new Norwegian growth reference and the WHO growth standard to be of clinical relevance. The average birth weight of Norwegian boys is currently 410 g and that for girls is 380 g higher than the birth weight in the WHO standard. The Norwegian children in the WHO study had – not surprisingly – the same average birth weight as those in our study. The low birth weight in other countries impacts on and reduces the average birth weight in the WHO study (20, 29).
The new growth reference for Norwegian children uses a height that is somewhat higher than the WHO standard. Length growth during the first two years for the Norwegian children who participated in the WHO study, is still more similar to that in our growth references than to that in the full WHO study.
It is difficult to compare weight data from the Bergen Growth Study with those in the WHO study, as weight data from individual participating countries were not published separately, and because the heaviest children were excluded from the WHO material (22).
Percentiles for head circumference in the WHO study are at all times lower than those in the new Norwegian growth reference, but the WHO data differ even more from those in the SYSBARN study. Head circumference was measured in the same way in the Bergen Growth Study and the WHO study.
Differences in length growth, head circumference, and possibly also weight challenges the WHO’s position that children who grow up under beneficial conditions will follow the same grow pattern (11, 30). This relates to the ongoing discussing on whether WHO growth standards can replace national references (30).
The new Norwegian growth reference – as the earlier ones – is targeted at children with a Norwegian ethnic background. It has yet to be compared with children from other ethnic backgrounds in the Bergen Growth Study. We chose to restrict the charts to children from a Norwegian ethnic background because the differences between ethnic groups are significant, with an increase in final height of up to 7 cm for population groups with beneficial living conditions (31, 32).
It is important that growth charts – representative for a healthy child population – are updated and available at all times. Percentile placement – especially the highest and lowest percentiles – are of consequence for definitions and assessments. In our opinion, several of the differences documented in this article-through comparison with earlier Norwegian growth references and WHO’s international growth standards – are clinically relevant. To avoid subjecting children to unnecessary assessments and worries it is important that updated professional guidelines are made available in this field in Norway.
Conclusion
Norwegian school children are taller and heavier today than in the 1970s. The development towards an increase in overweight mainly affects a subgroup of children. Weight-for-height for children younger than 5 years has not changed much since the early 1980s. The fact that Norwegian children deviate from the WHO growth standards – with respect to birth weight and weight in general, weight-for-height, and head circumference – may reflect that living conditions and/or growth potential differs between the populations.
