In late March/early April of 2009, a new strain of influenza A (H1N1) was discovered in North America. The infection spread rapidly over most of the world, and on 11 June 2009, the World Health Organization declared the first influenza pandemic since 1968 (1). In Norway, several preparatory measures were taken to counter the new epidemic. In addition to mass vaccinations and medication of those infected, major emphasis was placed on preventive measures against the spread of infection. In June, the Norwegian Directorate of Health and the Norwegian Institute of Public Health issued a poster displaying four simple hygiene recommendations to the population (figure 1). The recommendations were repeated in TV campaigns and were frequently quoted by the media.

Figure 1: The poster «Habits that prevent influenza» was issued in June 2009 and distributed to pharmacies, doctors’ surgeries, municipal medical officers and health enterprises nationwide.
In the autumn of 2009, the swine flu epidemic was a dominant factor in Norwegian public life. The authorities were concerned that the epidemic could cause high mortality, and the Norwegian media reinforced this concern (2). General practitioners and out-of-hours services were inundated by calls from worried patients (3). The hygiene recommendations started to have an effect, however. People washed their hands and coughed into their elbows, and bottles of hand disinfectant appeared in day-care centres, schools, shops and workplaces. In July 2009, Aftenposten reported that the sale of ethanol-based hand disinfectant had skyrocketed, the pharmacies had run out of supplies and some manufacturers had waiting lists to the end of the year (4).
Previous studies have shown that proper hand hygiene can reduce the incidence of respiratory tract infections and intestinal infections (5 – 8). The effect appears to be especially great when the intervention targets small children (6). In a Danish prospective controlled study, involving group-based training of personnel and children in day-care centres, including provision of written material to parents, absence due to illness among the children was reduced by 34 per cent. The same study revealed a significant reduction in the occurrence of diarrhoea and conjunctivitis (9).
The purpose of our study was to investigate whether the contact rate for infectious diseases registered by out-of-hours services changed during the course of the hygiene campaign. The campaign was mainly targeting the flu virus, but we have no possibility to demonstrate any such effect, since we have no relevant control group. We therefore wished to compare the contact rates observed during the autumn of 2009 with an average for the autumn seasons of 2006, 2007 and 2008 for other infectious diseases for which the hygiene recommendations can be assumed to have an effect, and a control group of urinary tract infections.
Material and methods
The material comprises all electronic doctors? bills submitted by out-of-hours physicians between 1 January 2006 and 31 December 2009. The de-personalized data files, from all regions of the country, were supplied by the Norwegian Labour and Welfare Administration (NAV) and the Norwegian Health Economics Administration (HELFO). The variables are time of contact (month), diagnosis (ICPC-2 diagnosis codes) and age of patient. The material covers all types of contacts, including consultations, home visits, simple contacts and telephone contacts. Paper-based reimbursement claims, and reimbursements paid directly to the patient in cases where the physician in question had no contract for direct reimbursement, are not included. These have been estimated to account for 4.9 per cent of all contacts with out-of-hours services in 2006 (10).
In addition to the influenza we chose to analyse seven other infections that may be related to hand hygiene (table 1). As a control factor we included urinary tract infections, which we assumed would be unaffected by the hygiene recommendations. We registered the number of contacts per month for each of these diseases, and calculated a monthly average for the years 2006 – 2008. This average was compared to the number of contacts per month in 2009 (Fig. 2a, E-fig. 2b). Since the intervention (the hygiene campaign) only took place in the second half of 2009, we made a tabular comparison of the contact rates (per 1,000 inhabitants) for the period 1 July to 31 December. Since the graphical analysis indicated major changes in the wake of the influenza epidemic, we chose to make a separate, corresponding tabular analysis for December.
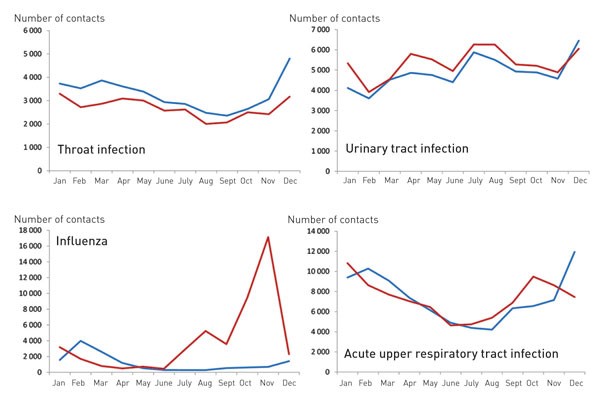
Figure 2a: Number of contacts per month with out-of-hours services for various infectious diseases 2009 (red) and average for the years 2006–2008 (blue). Different scales. Other infectious diseases are shown in e-figure 2b, which is found only in the Internet issue of the journal.
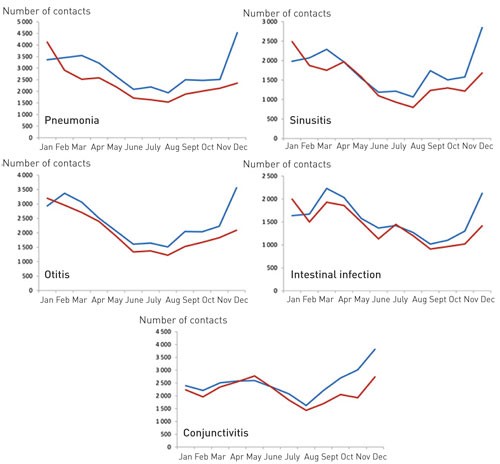
E-figure 2b: Number of contacts per month with out-of-hours services for various infectious diseases 2009 (red) and average for the years 2006 – 2008 (blue). Different scales.
|
Table 1 Contact rate in out-of-hours medical services (per 1,000 inhabitants) from 1 July to 31 December 2009, compared to an average for the corresponding periods of 2006 – 2008, and the ratio (confidence interval 95 per cent) between the contact rates.
|
|
Diagnoses
|
ICPC-2 code
|
Contact rate 2006 – 2008 (n = 4 686 175)
|
Contact rate 2009 (n = 4 799 252)
|
Contact rate ratio (95 % CI)
|
|
Influenza
|
R80
|
0.83
|
8.46
|
10.25 (9.91 – 10.59)
|
|
Acute upper respiratory tract infection
|
R74
|
8.66
|
8.88
|
1.02 (1.01 – 1.04)
|
|
Conjunctivitis
|
F70
|
3.29
|
2.43
|
0.74 (0.72 – 0.76)
|
|
Otitis
|
H71
|
2.78
|
2.02
|
0.73 (0.71 – 0.75)
|
|
Sinusitis
|
R75
|
2.12
|
1.49
|
0.70 (0.68 – 0.72)
|
|
Throat infection
|
R72, R76
|
3.89
|
3.08
|
0.79 (0.78 – 0.81)
|
|
Pneumonia
|
R81
|
3.44
|
2.41
|
0.70 (0.68 – 0.72)
|
|
Intestinal infection
|
D70, D73
|
1.76
|
1.45
|
0.82 (0.80 – 0.85)
|
|
Urinary tract infection
|
U71, U72
|
6.88
|
7.08
|
1.03 (1.01 – 1.04)
|
The project was assessed by the official responsible for data protection in NAV and the Privacy Ombudsman for Research. Since the material does not allow identification of individuals, either directly or indirectly, the project was not subject to the notification requirement stipulated by the Personal Data Act.
Results
In 2006, there were a total of 1,626,644 presentations to out-of-hours services. This figure increased gradually in the following years, and reached 1,782,761 in 2009. Table 1 shows that the contact rate for influenza was ten times higher in the autumn of 2009 than in the three preceding years. There was a marked decrease in all the other forms of infection, with the exception of acute upper respiratory tract infections and urinary tract infections. Table 2 shows that in December there were also significantly fewer cases of acute upper respiratory tract infection, while there were only minor changes in the rate of urinary tract infections. The tendency was identical across all age groups (data not shown).
|
Table 2 Contact rate in out-of-hours medical services (per 1 000 inhabitants) in December 2009, compared to an average for December 2006 – 2008, and the ratio (confidence interval 95 per cent) between the contact rates.
|
|
Diagnoses
|
ICPC-2 code
|
Contact rate 2006 – 2008 (n = 4 686 175)
|
Contact rate 2009 (n = 4 799 252)
|
Contact rate ratio (95 % CI)
|
|
Influenza
|
R80
|
0.30
|
0.48
|
1,59 (1,48 – 1,69)
|
|
Acute upper respiratory tract infection
|
R74
|
2.53
|
1.55
|
0,61 (0,60 – 0,63)
|
|
Conjunctivitis
|
F70
|
0.77
|
0.57
|
0,74 (0,70 – 0,77)
|
|
Otitis
|
H71
|
0.72
|
0.44
|
0,61 (0,58 – 0,64)
|
|
Sinusitis
|
R75
|
0.60
|
0.35
|
0,58 (0,55 – 0,62)
|
|
Throat infection
|
R72, R76
|
1.00
|
0.66
|
0,66 (0,63 – 0,69)
|
|
Pneumonia
|
R81
|
0.97
|
0.45
|
0,47 (0,45 – 0,49)
|
|
Intestinal infection
|
D70, D73
|
0.44
|
0.29
|
0,66 (0,61 – 0,70)
|
|
Urinary tract infection
|
U71, U72
|
1.38
|
1.26
|
0,92 (0,88 – 0,95)
|
Figure 2 shows that there were fewer contacts for several of the infectious diseases during all of 2009. Contacts for acute upper respiratory tract infection increased more than usual in early autumn 2009, concurrent with the influenza, but subsequently fell to below average towards the end of the year, in the wake of the influenza epidemic.
Discussion
This material is as good as exhaustive. It was estimated that the excluded cases accounted for less than five per cent for 2006, and even less for the following years. The introduction of automatic exemption cards requires reimbursement claims to be submitted electronically. To the extent that the number of excluded cases has decreased, this may serve to conceal a possible effect of the hygiene intervention, but we believe that these deviations are so small as to be negligible.
Diagnoses in out-of-hours services are most commonly based solely on the anamnesis and a clinical examination. To some extent one can rely on measurement of C-reactive protein, urine sample and a rapid identification test for streptococci, but erroneous diagnostication will obviously occur. There is, however, little reason to assume that the number of erroneous diagnoses will vary significantly from one year to the next, and comparisons at group level may therefore still remain valid.
The extreme attention paid to the influenza in 2009 may, however, have contributed to a systematically excessive diagnostication of influenza at the cost of other, similar infections. We could nevertheless see that the contact rate for acute upper respiratory tract infection increased in parallel with the rate for influenza at the early stages of the epidemic. In most cases the swine flu was fairly mild (11), and in some cases it may have been classified as a regular common cold. In the wake of the influenza epidemic the occurrence of acute upper respiratory tract infection was significantly lower in 2009 than in the preceding years.
Changes in behaviour related to doctor visits may also have exerted an effect on the registered contact rate for various diseases. One can imagine that persons with milder conditions refrained from calling on the out-of-hours services and instead contacted their regular GP during the influenza epidemic. The regular GPs have nearly nine times as many consultations as the out-of-hours services (10), so that even minor changes in the use of regular GPs may entail major changes in the use of out-of-hours services. We have no relevant data on the contact rates among the GPs, but our data indicate that the number of registered contacts at the out-of-hours services increased at an even pace throughout the entire period from 2006 to 2009.
Our hypothesis was that we were going to observe fewer cases of respiratory tract infections and intestinal infections as a result of the hygiene recommendations. On the other hand, we would not expect the rate of urinary tract infections to be affected by a campaign for better hand hygiene. Our findings confirm this hypothesis. The observations concur with a possible effect of the hygiene campaign. However, other alternative explanations may also be put forward.
Since there were already fewer infectious diseases in the first half of 2009 compared to the preceding years, this is most likely an effect of natural variations. This applies to pneumonia, throat infection, otitis, intestinal infections and to some extent sinusitis. However, figure 2 shows a tendency towards fewer contacts for all the infectious diseases (with the exception of urinary tract infections) at the end of the year. This may be caused by the fact that some time elapsed before the hygiene recommendations could take full effect (12), but could also be ascribed to the possibility that the population took more precautionary hygiene measures and exposed themselves less to infection at the peak of the influenza epidemic.
It is also possible that the low contact rate for infectious diseases in the wake of the influenza epidemic may be associated with biological effects of the epidemic, virus interference (13). It is less likely that this has had an effect on bacterial infections, even though viral infections of the respiratory tract often form the basis for bacterial infections of the airways. It is difficult to distinguish such biological effects from the effects of improved hygiene.
The hygiene measures were implemented during the summer, while the influenza virus reached its peak in October/November. When seeing that the reduction in the number of contacts for conjunctivitis started relatively early, we may reasonably assume that the hygiene recommendations have had at least a certain impact on this disease.
Even among the elderly we found fewer respiratory tract infections and fewer intestinal infections (data not shown). Elderly persons were only infected by the swine flu to a limited extent, and we may therefore assume that biological effects of the epidemic itself may have played only a minor role for this age group. On the other hand, the elderly would also be exposed to less pressure of contagion, because of the general lower rate of infectious diseases in the population.
Conclusion
There was a decrease in the contact rate for respiratory tract infections and intestinal infections towards the end of 2009. Our data are concurrent with this being an effect of the hygiene campaign, although other factors may have contributed to this outcome.
